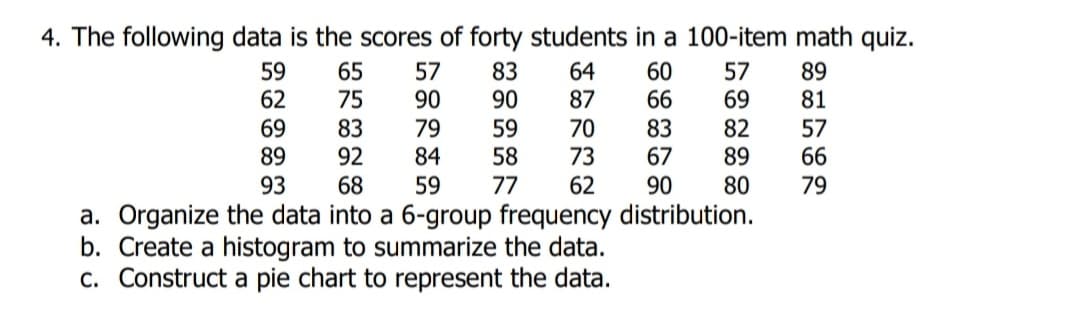
4. The following data is the scores of forty students in a 100-item math quiz. 65 75 83 92 83 90 59 64 87 60 66 59 89 57 90 79 84 57 62 81 69 82 89 69 70 73 83 67 90 57 66 79 89 58 93 68 59 77 62 80 a. Organize the data into a 6-group frequency distribution. b. Create a histogram to summarize the data. C. Construct a pie chart to represent the data.
4. The following data is the scores of forty students in a 100-item math quiz. 65 75 83 92 83 90 59 64 87 60 66 59 89 57 90 79 84 57 62 81 69 82 89 69 70 73 83 67 90 57 66 79 89 58 93 68 59 77 62 80 a. Organize the data into a 6-group frequency distribution. b. Create a histogram to summarize the data. C. Construct a pie chart to represent the data.

Glencoe Algebra 1, Student Edition, 9780079039897, 0079039898, 2018
18th Edition
ISBN:9780079039897
Author:Carter
Publisher:Carter
Chapter10: Statistics
Section10.4: Distributions Of Data
Problem 19PFA

Related questions
Question
Please show step by step solution
Transcribed Image Text:4. The following data is the scores of forty students in a 100-item math quiz.
59
62
65
75
57
90
83
90
64
87
60
66
57
69
89
81
69
89
83
92
79
84
59
58
77
70
73
83
82
89
57
66
67
93
68
59
62
90
80
79
a. Organize the data into a 6-group frequency distribution.
b. Create a histogram to summarize the data.
c. Construct a pie chart to represent the data.
Expert Solution
This question has been solved!
Explore an expertly crafted, step-by-step solution for a thorough understanding of key concepts.

Step by step
Solved in 2 steps with 5 images

Recommended textbooks for you
Glencoe Algebra 1, Student Edition, 9780079039897…
Algebra
ISBN:
9780079039897
Author:
Carter
Publisher:
McGraw Hill
Glencoe Algebra 1, Student Edition, 9780079039897…
Algebra
ISBN:
9780079039897
Author:
Carter
Publisher:
McGraw Hill