17. How many observations are there?

MATLAB: An Introduction with Applications
6th Edition
ISBN:9781119256830
Author:Amos Gilat
Publisher:Amos Gilat
Chapter1: Starting With Matlab
Section: Chapter Questions
Problem 1P

Related questions
Question
17. How many observations are there?
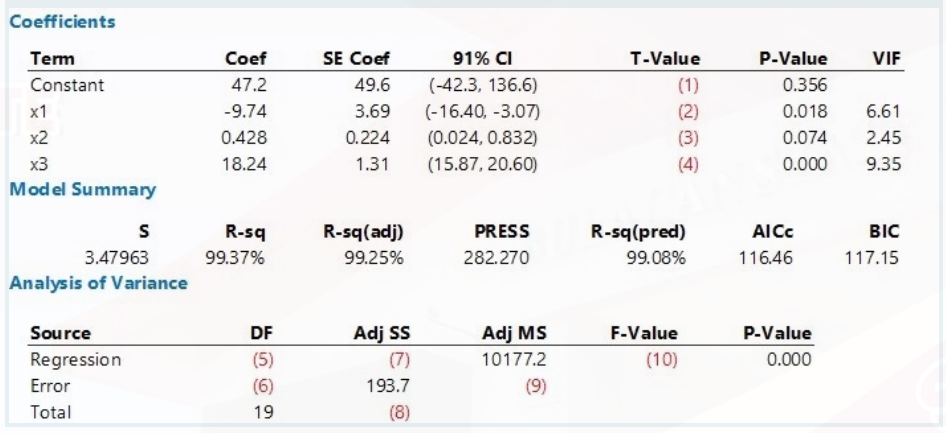
Transcribed Image Text:Coefficients
Term
Constant
x1
x2
x3
Model Summary
S
3.47963
Analysis of Variance
Source
Regression
Error
Total
Coef
47.2
-9.74
0.428
18.24
R-sq
99.37%
DF
(5)
(6)
19
91% CI
SE Coef
49.6
(-42.3, 136.6)
3.69
(-16.40, -3.07)
0.224 (0.024, 0.832)
1.31
(15.87, 20.60)
R-sq(adj)
PRESS
99.25%
282.270
Adj SS
193.7
(8)
Adj MS
10177.2
(9)
T-Value
(1)
(2)
(3)
(4)
R-sq (pred)
99.08%
F-Value
(10)
P-Value
VIF
0.356
0.018
6.61
0.074
2.45
0.000 9.35
BIC
117.15
AICC
116.46
P-Value
0.000
Expert Solution
This question has been solved!
Explore an expertly crafted, step-by-step solution for a thorough understanding of key concepts.

Step by step
Solved in 2 steps with 2 images

Recommended textbooks for you
MATLAB: An Introduction with Applications
Statistics
ISBN:
9781119256830
Author:
Amos Gilat
Publisher:
John Wiley & Sons Inc

Probability and Statistics for Engineering and th…
Statistics
ISBN:
9781305251809
Author:
Jay L. Devore
Publisher:
Cengage Learning

Statistics for The Behavioral Sciences (MindTap C…
Statistics
ISBN:
9781305504912
Author:
Frederick J Gravetter, Larry B. Wallnau
Publisher:
Cengage Learning
MATLAB: An Introduction with Applications
Statistics
ISBN:
9781119256830
Author:
Amos Gilat
Publisher:
John Wiley & Sons Inc
Probability and Statistics for Engineering and th…
Statistics
ISBN:
9781305251809
Author:
Jay L. Devore
Publisher:
Cengage Learning
Statistics for The Behavioral Sciences (MindTap C…
Statistics
ISBN:
9781305504912
Author:
Frederick J Gravetter, Larry B. Wallnau
Publisher:
Cengage Learning

Elementary Statistics: Picturing the World (7th E…
Statistics
ISBN:
9780134683416
Author:
Ron Larson, Betsy Farber
Publisher:
PEARSON

The Basic Practice of Statistics
Statistics
ISBN:
9781319042578
Author:
David S. Moore, William I. Notz, Michael A. Fligner
Publisher:
W. H. Freeman

Introduction to the Practice of Statistics
Statistics
ISBN:
9781319013387
Author:
David S. Moore, George P. McCabe, Bruce A. Craig
Publisher:
W. H. Freeman