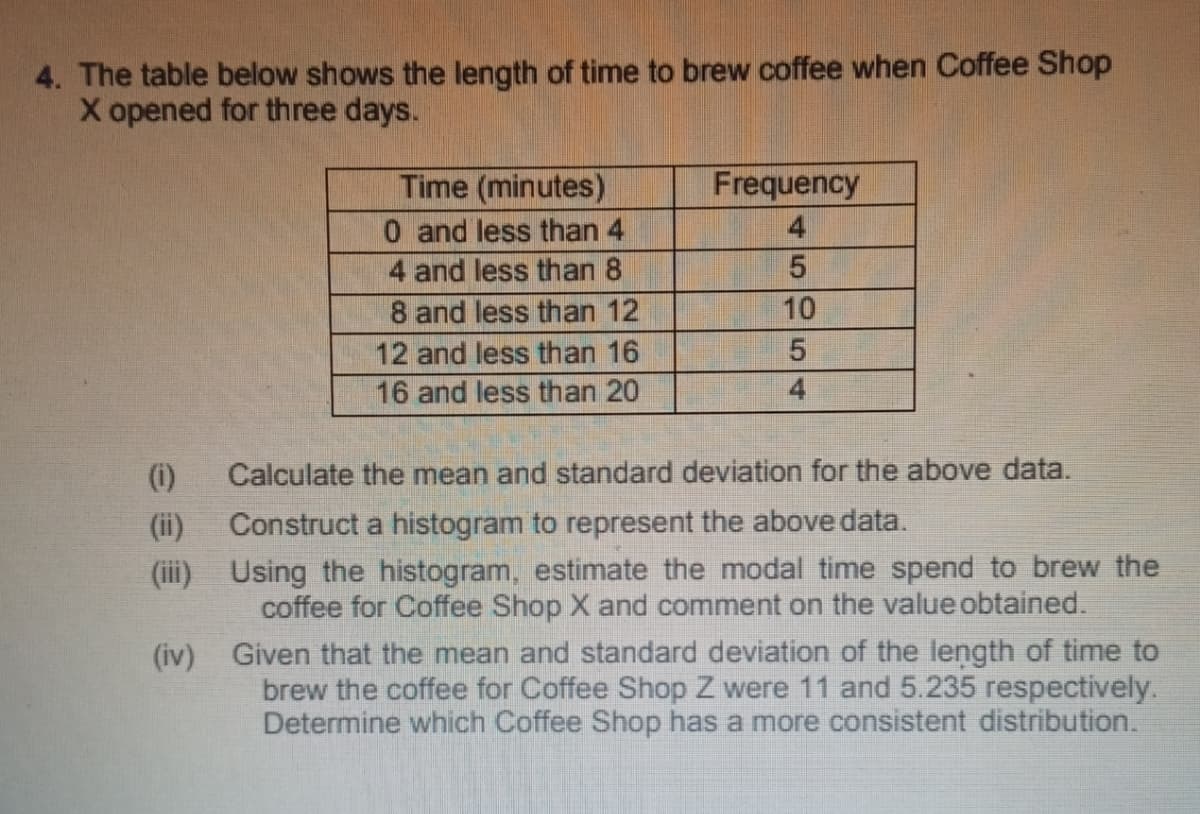
4. The table below shows the length of time to brew coffee when Coffee Shop X opened for three days. Time (minutes) Frequency 0 and less than 4 4 4 and less than 8 5 8 and less than 12 10 12 and less than 16 5 16 and less than 20 4 (1) Calculate the mean and standard deviation for the above data. (ii) Construct a histogram to represent the above data. (iii) Using the histogram, estimate the modal time spend to brew the coffee for Coffee Shop X and comment on the value obtained. (iv) Given that the mean and standard deviation of the length of time to brew the coffee for Coffee Shop Z were 11 and 5.235 respectively. Determine which Coffee Shop has a more consistent distribution.
4. The table below shows the length of time to brew coffee when Coffee Shop X opened for three days. Time (minutes) Frequency 0 and less than 4 4 4 and less than 8 5 8 and less than 12 10 12 and less than 16 5 16 and less than 20 4 (1) Calculate the mean and standard deviation for the above data. (ii) Construct a histogram to represent the above data. (iii) Using the histogram, estimate the modal time spend to brew the coffee for Coffee Shop X and comment on the value obtained. (iv) Given that the mean and standard deviation of the length of time to brew the coffee for Coffee Shop Z were 11 and 5.235 respectively. Determine which Coffee Shop has a more consistent distribution.

Algebra & Trigonometry with Analytic Geometry
13th Edition
ISBN:9781133382119
Author:Swokowski
Publisher:Swokowski
Chapter4: Polynomial And Rational Functions
Section4.2: Properties Of Division
Problem 2E

Related questions
Question
100%
I'm confused how to answer iii and iv..please help me..thank you
Transcribed Image Text:4. The table below shows the length of time to brew coffee when Coffee Shop
X opened for three days.
Time (minutes)
Frequency
4
0 and less than 4
4 and less than 8
5
8 and less than 12
10
12 and less than 16
5
16 and less than 20
4
(1)
Calculate the mean and standard deviation for the above data.
(ii)
Construct a histogram to represent the above data.
(iii)
Using the histogram, estimate the modal time spend to brew the
coffee for Coffee Shop X and comment on the value obtained.
(iv)
Given that the mean and standard deviation of the length of time to
brew the coffee for Coffee Shop Z were 11 and 5.235 respectively.
Determine which Coffee Shop has a more consistent distribution.
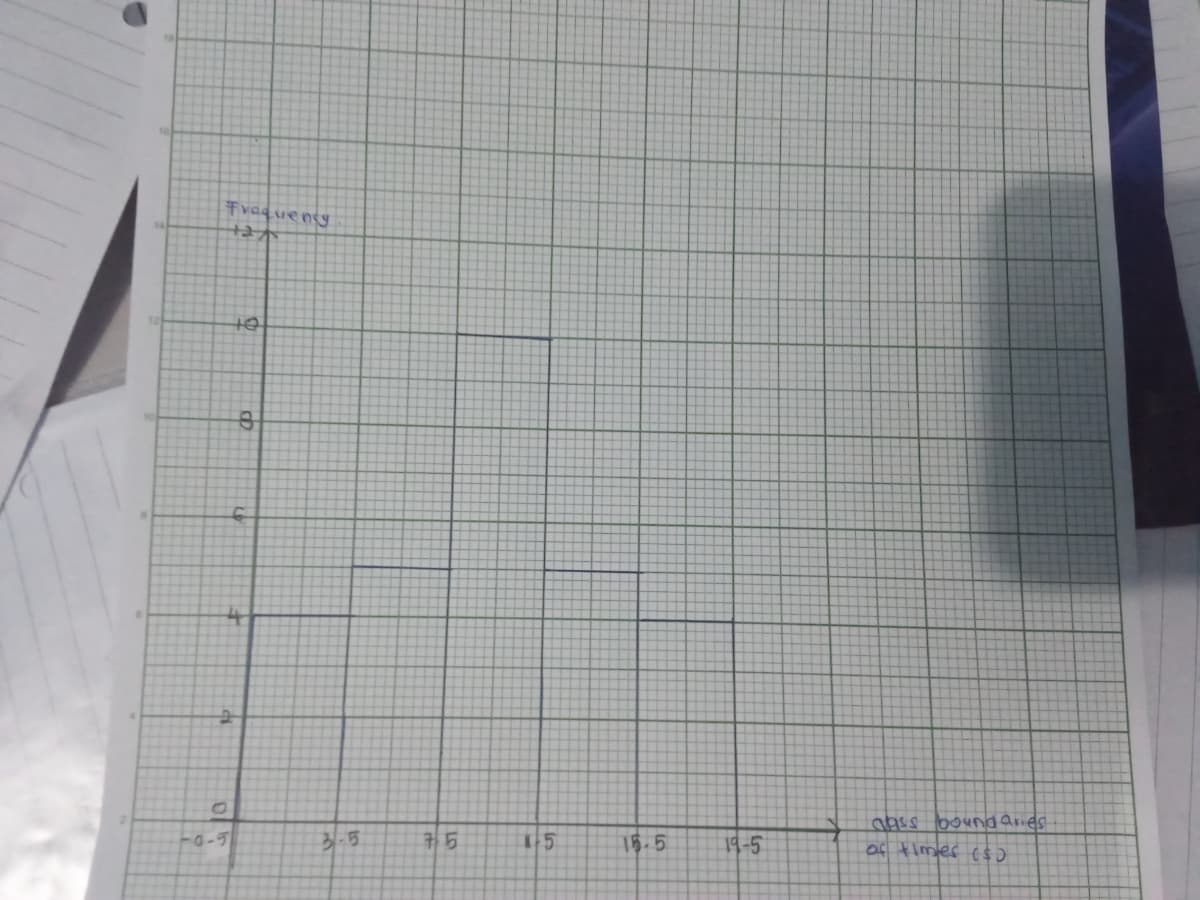
Transcribed Image Text:Frequency
+275
O
-0-5
et
di
8
3-5
75
15
18.5
19-5
aass boundaries
of times ($)
Expert Solution
This question has been solved!
Explore an expertly crafted, step-by-step solution for a thorough understanding of key concepts.

Step by step
Solved in 4 steps with 1 images

Recommended textbooks for you
Algebra & Trigonometry with Analytic Geometry
Algebra
ISBN:
9781133382119
Author:
Swokowski
Publisher:
Cengage

College Algebra (MindTap Course List)
Algebra
ISBN:
9781305652231
Author:
R. David Gustafson, Jeff Hughes
Publisher:
Cengage Learning

College Algebra
Algebra
ISBN:
9781305115545
Author:
James Stewart, Lothar Redlin, Saleem Watson
Publisher:
Cengage Learning
Algebra & Trigonometry with Analytic Geometry
Algebra
ISBN:
9781133382119
Author:
Swokowski
Publisher:
Cengage
College Algebra (MindTap Course List)
Algebra
ISBN:
9781305652231
Author:
R. David Gustafson, Jeff Hughes
Publisher:
Cengage Learning
College Algebra
Algebra
ISBN:
9781305115545
Author:
James Stewart, Lothar Redlin, Saleem Watson
Publisher:
Cengage Learning

Holt Mcdougal Larson Pre-algebra: Student Edition…
Algebra
ISBN:
9780547587776
Author:
HOLT MCDOUGAL
Publisher:
HOLT MCDOUGAL