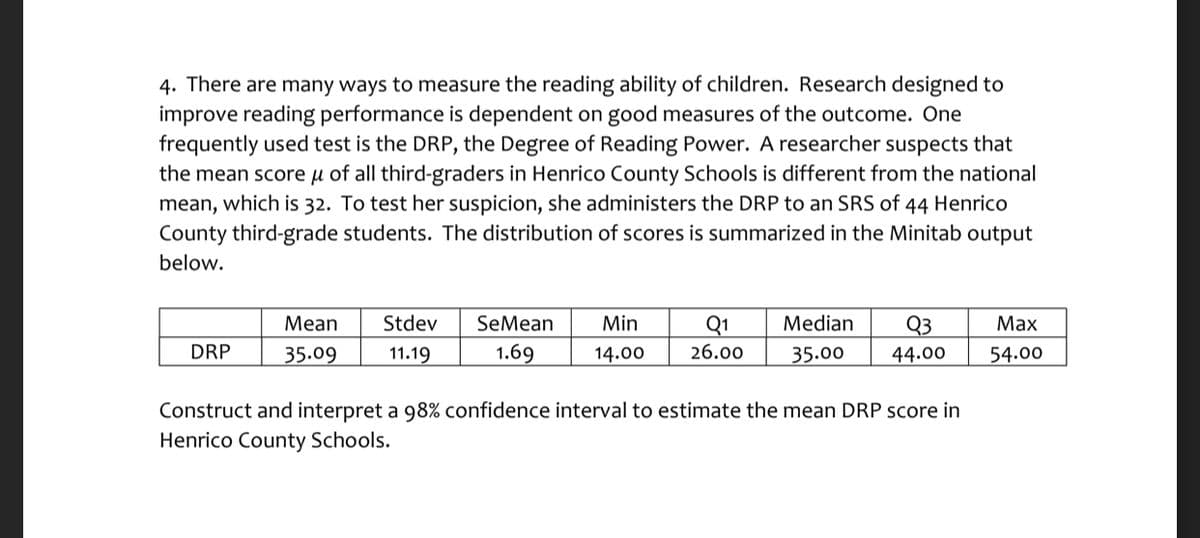
4. There are many ways to measure the reading ability of children. Research designed to improve reading performance is dependent on good measures of the outcome. One frequently used test is the DRP, the Degree of Reading Power. A researcher suspects that the mean scoreu of all third-graders in Henrico County Schools is different from the national mean, which is 32. To test her suspicion, she administers the DRP to an SRS of 44 Henrico County third-grade students. The distribution of scores is summarized in the Minitab output below. Mean Stdev SeMean Min Q1 Median Q3 Маx DRP 35.09 11.19 1.69 14.00 26.00 35.00 44.00 54.00 Construct and interpret a 98% confidence interval to estimate the mean DRP score in Henrico County Schools.


Inverse Normal Distribution
The method used for finding the corresponding z-critical value in a normal distribution using the known probability is said to be an inverse normal distribution. The inverse normal distribution is a continuous probability distribution with a family of two parameters.
Mean, Median, Mode
It is a descriptive summary of a data set. It can be defined by using some of the measures. The central tendencies do not provide information regarding individual data from the dataset. However, they give a summary of the data set. The central tendency or measure of central tendency is a central or typical value for a probability distribution.
Z-Scores
A z-score is a unit of measurement used in statistics to describe the position of a raw score in terms of its distance from the mean, measured with reference to standard deviation from the mean. Z-scores are useful in statistics because they allow comparison between two scores that belong to different normal distributions.


Trending now
This is a popular solution!

Step by step
Solved in 2 steps


