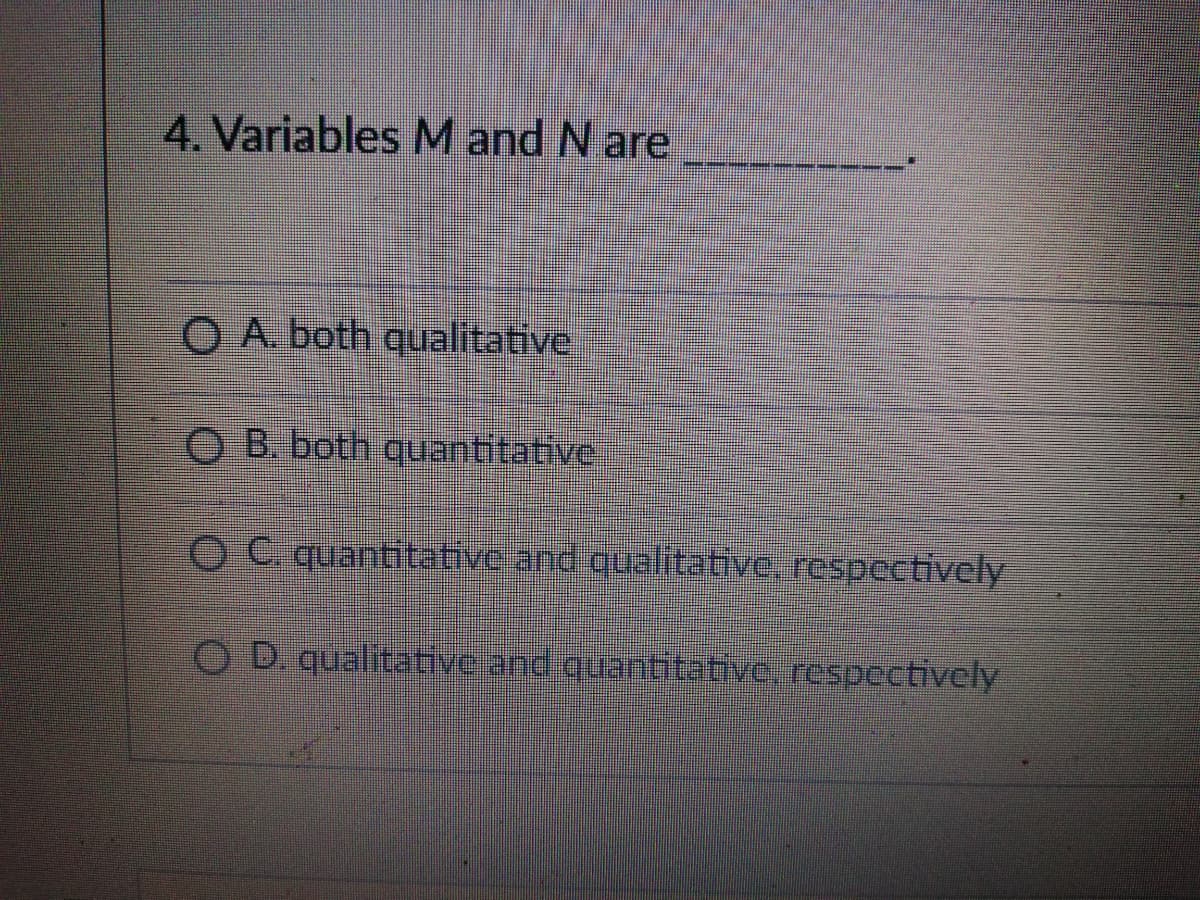
4. Variables M and N are O A. both qualitative R-keth


Q: The state lottery board is examining the machine that randomly picks the lottery numbers. On each tr...
A:
Q: Property 4. If the distribution function of a r.v. X is symmetrical about zero, i.e., if 1– F(x) = F...
A:
Q: Gracia, an ALS student, obtained a z-score of 1.35 in an achievement test that is normally distribut...
A: Given : Z-score=1.35 Mean=85 Standard deviation =5
Q: I am struggling to calculate the percentage using the standard normal curve and whilst applying z sc...
A: Part a. A Z-score of zero represents a value that equals the mean. The further away an observation's...
Q: The following are the weight (kg) of 20 senior high school students
A: Procedure to obtain mean, variance, and standard deviation in TI-83 calculator: Click on STAT. Go t...
Q: (a) If 400 murders are randomly selected, how many would we expect to be committed with a firearm...
A: Given: probability of murders committed, p=0.512 sample size, n=400
Q: The event of holding your breath for 30 minutes is __________. A.a sure event B.an equally likely ev...
A: Impossible event An event is said to be an impossible event when the probability of occurrence of th...
Q: The following data were collected by counting the number of operating rooms in use at Tampa General ...
A:
Q: Question 1 Consider a 3 dimensional contingency table. Decide if the following statements are true o...
A:
Q: At what level are the following variables measured? _______________ 1. The scores of students in a s...
A: Solution-: At what level are the following variables measured?
Q: What does the standard deviation measure?
A:
Q: Find the z value such that the area under the standard normal distribution curve between 0 and the z...
A: Solution-: Let, Z-be the standard normal random variable We find, P(0<Z<0.2123)=?
Q: You want to obtain a sample to estimate a population proportion. At this point in time, you have no ...
A: Given,margin of error(E)=0.05Assume sample proportion (p^)=0.5α=1-0.99=0.01α2=0.005Z0.005=2.58 (f...
Q: Consider the following probability density function of random variasle X f(x) = {kv 0<1<1 otherwise ...
A:
Q: Example 12. Find the average marks of students from the following table : Marks No. of students Mark...
A: Given data is Marks No. of students Above 0 80 Above 10 77 Above 20 72 Above 30 65 Abo...
Q: 3. Researchers are interested in estimating the average number of credit hours Freshmen take per sem...
A: Given data A random sample of 50 freshmen is obtained The average of hours taken per semester was 14...
Q: A manufacturer of front light for automobiles tests lamps under a high humidity, high temperatu Usef...
A:
Q: Given the power regression model y = 20x^1.6, which is the linear regression model after transformin...
A: The dependent variable is y and the independent variable is x. The log-log regression model can be g...
Q: 4. The distance of the number in the horizontal line or the x-axis should always proportional. 5 The...
A: We have given that, (4) The distance of the number in the horizontal line or the x- axis should alwa...
Q: Events A andB are independent. Find the missing probability. P(A) = (2/3), P(B) = (4/5), P(A and B) ...
A: We have given that, A and B are two independent events with P(A)=(2/3) , P(B) = (4/5) Then, We...
Q: Assume that children's IQs (Age 6-12) follow a normal distribution with mean 100 and standard deviat...
A:
Q: Each year students in a local school district write a national examination. The average on this nati...
A: Given data Mean = 150 Standard deviation=20
Q: A wine producer believes that a new advertisement will increase product sales in LCBO by an average ...
A:
Q: In a recent survey of 655 working Americans ages 25 - 34, the average weekly amount spent on lunch w...
A:
Q: Topic: Correlation Question: Assuming that a given data is normally distributed, will the R-square...
A: Given that a given data is normally distributed, will the R-squared value be meaningful to describe ...
Q: Property 5. If X is some r.v. with characteristic function ox (t), and if u,' = E (X) exists, then H...
A:
Q: in a random sample of 500 persons belonging to urban area 200 are found 1o be commuters of public tr...
A:
Q: Using your own words, discuss how a correlated-groups t test has more statistical power in compariso...
A:
Q: The following are the amounts of income tax paid by 600 businessmen in the year 1975: More than doll...
A:
Q: Theorem 7-12. If (p} and {r) are the sequences with probability generating functions P(s) and R(s) r...
A:
Q: 3. The universe of the study is O A. the set of all residents in NCR O B. the set of all Covid-19 pa...
A: Given that due to the alarming cases of Covid-19, a researcher wanted to study the characteristics o...
Q: Having more than 1000 students in a year, assume that I choose a simple random samples of 30 final e...
A: given data sample size n =30 The results show that 5% of the grades are over 2.1 and 5% are under 1...
Q: The equation y = 9x + 15 represents the relationship between the number of bags sold and the cost of...
A: Given equation is y=9x+15and no.of bags sold (x) is 18.
Q: The following data present the yields in quintals of common ten subdivisions of equal area of two ag...
A:
Q: Calculate the consumer price index number for 2015 on the basis of 2000 from the following data by u...
A:
Q: Use the properties of the mean and median to determine which are the correct mean and median for the...
A: Here we see that from above graph that, distribution is positively skewed. Here mean is lies in mor...
Q: Example 5-44. Given :f (x, y) = e -(x+y) Io. c (x). I(0, -) (y). Are X and Y independent ? Find (i) ...
A:
Q: he management at Massachusetts Savings Bank is always concerned about the quality of service provide...
A: Solution: Given information: n= 70 Sample size x = 27 Sample mean s =2.5 Sample standard deviation ...
Q: Property 7. If X and Y are two random variables such that Y<X ,then E (Y) <E (X), provided all the e...
A:
Q: Express the confidence interval 0.175 + 0.064 in open interval form (i.e., (0.155,0.855), Question H...
A:
Q: According to a recent survey, 35% of respondents drive Japanese-made cars. From a random sample of f...
A: Let X be tbe number of driving a Japanese-made car from Binomial distribution with probability (p)= ...
Q: Which LISA statistic does not include the target feature in the analysis and instead calculates clus...
A: LISA statistics: LISA statistics are designed to reject the null hypothesis of spatial randomness in...
Q: Two cards are drawn from a well-shuffled deck. What is the chance they are not both aces? (Be carefu...
A:
Q: question(3): based on an article published in the city of toronto the response time is 6 ,7 ,9...
A: The sample mean is as follows: The sample standard deviation is as follows:
Q: Explain Statistics & Sampling Variability and how does it affect the parameters and random variables...
A: The number that can be computed from sample data is a statistic. x=sample means=standard deviation ...
Q: Did male residents seem to be more or less aggressive (by displaying dominance behaviors) towards in...
A: From the given information, The investigator is specifically interested to test whether the male re...
Q: ) If a computer keyboard is randomly selected then find the lifetime that the keyboard is 60% certai...
A:
Q: What is the probability of flipping a quarter four times and it landing on Tails each time? Leave yo...
A: The outcomes of flipping a quarter are {Head, Tail}.
Q: Write the null and alternative hypotheses you would use to test each of the situations in parts (a) ...
A:
Q: Find out by interpolation from the following data the number of workers earning $24 or more but less...
A:

Step by step
Solved in 2 steps

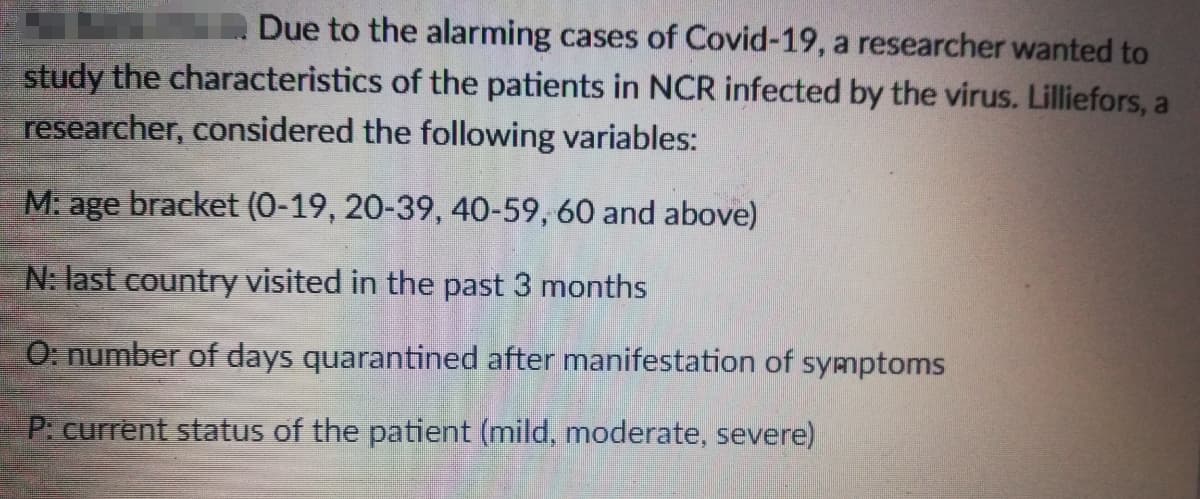
- Due to the alarming cases of Covid-19, a researcher wanted to study the characteristics of the patients in NCR infected by the virus. Lilliefors, a researcher, considered the following variables: M: age bracket (0-19, 20-39, 40-59, 60 and above) N: last country visited in the past 3 months O: number of days quarantined after manifestation of symptoms P: current status of the patient (mild, moderate, severe) 6. To answer the objective of the study, Lilliefors used different data collection methods. First, she gathered information about the variables of interest by letting the patients answer a self-administered questionnaire. Second, to supplement the data she gathered, she collected the sociodemographic profile of the patients using the data from the Department of Health. The methods of data collection used by Lilliefors are ________. A. objective and subjective, respectively B. subjective and objective, respectively C. objective and use of existing records, respectively…4. Due to the alarming cases of Covid-19, a researcher wanted to study the characteristics of the patients in NCR infected by the virus. Lilliefors, a researcher, considered the following variables: M: age bracket (0-19, 20-39, 40-59, 60 and above) N: last country visited in the past 3 months what is variable M and N? M: Qualitative or Quantitative? N: Qualitative or Quantitative?The COVID-19 (coronavirus) mortality rate of a country is defined as the ratio of the number of deaths due to COVID-19 divided by the number of (confirmed) cases of COVID-19 in that country. Suppose we want to investigate if there is any difference between the COVID-19 mortality rate in the US and the UK. On April 18, 2020, out of a sample of 671,493 cases of COVID-19 in the US, there was 33,288 deaths; and out of a sample of 109,754 cases of COVID-19 in the UK, there was 14,606 deaths. What is the 92% confidence interval in the true difference in the mortality rates between the two countries? What can you conclude about the difference in the mortality rates between the US and the UK? Justify your conclusions.
- To determine the average length of hospital stay for patients who were hospitalized with and recovered from Covid-19, a physician randomly surveyed 100 of his patients and determined their average length of hospital stay. Identify the population, parameter, sample, and statistic for the above scenario. Write "NONE" for any information that is missing.According to Johns Hopkins Medicine, the healthcare providers consider a fever to be 100.4◦F. Data was acquired in a health center that observed 24 adults with COVID- 19. We want to find out if the sample mean of 104◦F body temperature of adults with COVID-19 is significantly higher than the body temperature of a person with fever. Consider the sample SD of 10.2◦F.The article “State and Federal Data on COVID-19 Testing Don’t Match Up” by Meyer and Madrigal in May 2020 stated that Florida had reported conducting 700,000 coronavirus tests, yet the Centers for Disease Control and Prevention reported Florida had conducted 919,000. The difference between these reports is 219,000 tests. What is the difference between the number of tests Florida reported administering and the number the CDC reported the state-administered as a percent of the number of tests reported by Florida? Round your answer to the nearest hundredth of a percent.
- Governor Andy Beshear stated that COVID-19 is disproportionately affecting the AfricanAmerican community in Kentucky. As of April 21, there are 144 deaths from COVID-19 where the race of the patient is known, and of those 20 are African-American. AfricanAmericans make up 8% of the population of Kentucky overall. Does this information indicate that African-Americans in Kentucky are dying from COVID-19 at a disproportionate rate? Use an α = 0.05 significance level to test this claim. (d) What is the P-value?(e) Write a brief summary of your conclusion.Smoking History CoVID-19 Severity Low High Current 87 15 Former 43 9 Never 136 64 4.) One research question that could be posed using the available data: “Is there an advantage to being a Never smoker when it comes to CoVID-19 severity?” Essentially, we would like to know if the rate of High CoVID-19 severity is lower for Never smokers than it is for Current/Former smokers. Determine a method that would be appropriate for answering this research question. Using StatCrunch* and the available data, perform the statistical procedure deemed appropriate. Hint: In order to adequately answer this question, you will need to perform an additional statistical procedure a. What method did you use to answer the research question e.g., One-Sample t-Test for Means? b. Why did you select this particular method to answer the research question? c. In one to two complete sentences,…The Virginia Department of Health publishes COVID-19 vaccination data on their website. As of 10/5/2021, 60.6% of the population of Virginia is fully vaccinated. This rate varies drastically from county to county. Specifically, Fairfax County’s full vaccination rate is 74% and Lee County’s full vaccination rate is 40%. A researcher took a random sample of 14 individuals from Fairfax County and another random sample of 14 individuals from Lee County and asked them whether they could verify that they are fully vaccinated. Each sample was selected in a single day. 1. Calculate the mean and standard deviation of the number of individuals from Fairfax County and Lee County in this sample who are fully vaccinated. Show your work using the binomial mean and binomial standard deviation formulas and provide your two means and two standard deviations in your document. Round your answers to two decimal places. (It is not necessary to use StatCrunch for this part.) 2. Calculate the probability…
- During the Covid-19 pandemic, working from home has become the norm. Because of this, many households face an increasing monthly electricity bill. Mr. Tan is a research student at the Singapore University of Social Sciences, and his research focus is to examine the impact of Covid-19 on household electricity consumption. He hypothesised that the average monthly electricity bill in a household has increased more than $5 during the Covid-19 pandemic. In order to test his hypothesis, he collected the electricity bill data in 50 households in May 2020 when Singapore was during the circuit breaker period. Mr. Tan also found that the mean and standard deviation of electricity bill in a household in May 2019 are $26 and $7, respectively. In order to study the impact of Covid-19 on household electricity consumption, Mr. Tan intends to make a comparison of the average electricity bills in May 2019 and May 2020 in his analysis. Question 1. Apply an appropriate hypothesis test to determine if the…On April 30, 2020, in Chicago, 4510 people took Covid-19 test. The following table shows the test results by age group. Using data to determine whether tesgt results (positive or negative) is independent of age. Using .05 level of significance, what is the p-value and what is your conclusion? What conclusion can you draw about the relationship between results and people's age. Age 0-17 Age 18-29 Age 30-30 Age 40-49 Age 50-59 Age 60-69 Age 70-79 Age 80+ Age Unknown Positive 57 225 221 221 184 149 93 101 0 Negative 171 564 551 530 508 433 225 263 14What measures of fit are typically used to assess binary dependent variableregression models?


