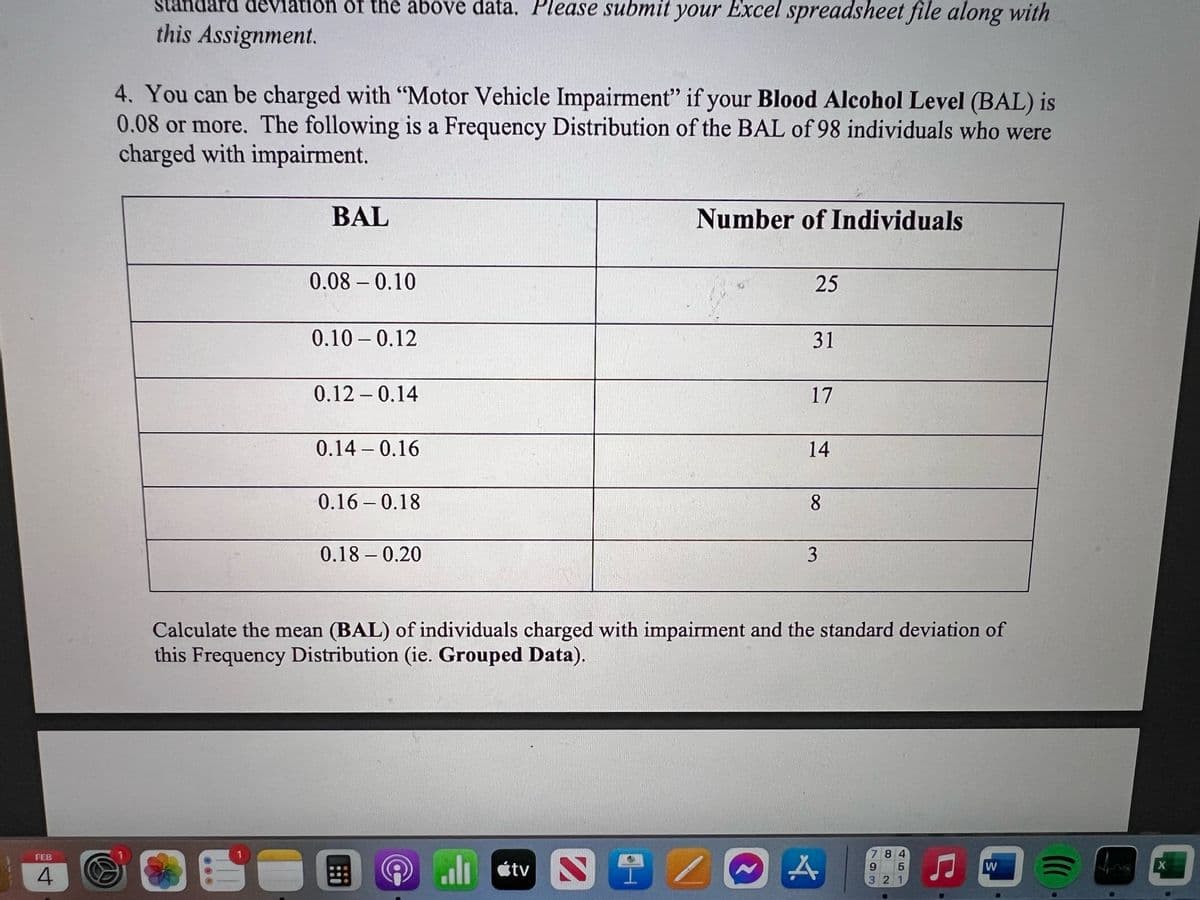
4. You can be charged with “Motor Vehicle Impairment” if your Blood Alcohol Level (BAL) is 0.08 or more. The following is a Frequency Distribution of the BAL of 98 individuals who were charged with impairment. Calculate the mean (BAL) of individuals charged with impairment and the standard deviation of this Frequency Distribution (ie. Grouped Data)


Q: In one survey, 1247 out of 1521 randomly selected people said that typing on a cell phone while…
A: From the provided information, Sample size (n) = 1521 From which 1247 said that typing on a cell…
Q: multiple linear regression model with 2 predictor variables and 10 observations, what is the…
A: Given that Number of predictor=k=2 Observation=n=10
Q: Is the variance for the amount of money, in dollars, that shoppers spend on Saturdays at the mall…
A: Given data: Saturday Sunday 75.5 123.4 80.2 111.6 60.7 90.6 65.2 85.9 90.6 92.9 87…
Q: If a random sample of size n = 36 is selected from a population with a standard deviation of σ = 6,…
A: Givensample size(n)=36population standard deviation(σ)=6
Q: If X is a continuous random variable with mean μ and standard deviation σ, what is the probability…
A: Answer: Approximately 68% of the values of X are expected to lie between μ - σ and μ + σ. This is…
Q: Heights of 10 year olds, regardless of gender, closely follow a normal distribution with mean 55…
A: given data normal distribution μ = 55σ = 6
Q: Was this an experiment or an observational study?
A: Here the individual is men and treatment is whether men diagnosed with cancer are assigned to…
Q: determine if there is a significant difference between the average height of two different species…
A: We have given that, n1 = n2 = 25 s1 = 2 and s2 = 3 x̄1 = 15 and x̄2 = 16 Then, We will find t-…
Q: 2.5 8.7 *** 9.6 O 9.5 O 2.7 4.6 O 0.5 *** 6.4 5.1 6.0 9.9 10.0 10.3 10.5 *** Consider the sample of…
A: The given observations are:
Q: A rock concert producer has scheduled an outdoor concert. The producer estimates the attendance will…
A: Given prob. distribution of attendance is:
Q: pls help me with this one
A:
Q: e whole solution or computation?
A: age group Total Population <1 9982 1-4 42457 5-9 56829 10-14 54930 15-19 48723 20-24…
Q: A researcher wants to test the average time it takes to solve a puzzle. They randomly sample 50…
A: Given: Sample size n=50 Sample mean x¯=8 Sample standard deviation s=2 Significance level α=0.05
Q: If Sample 1 has a variance of 4 and Sample 2 has variance of 32, can we tell which sample had a…
A: Given that Sample 1 Sample variance(s12)=4 Sample 2 Sample variance (s22)=32 We have to find which…
Q: Suppose we have a population with mean μ and standard deviation σ. If we take a random sample of…
A: From the provided information, We have a population with mean = μ Standard deviation = σ
Q: Suppose X and Y are independent random variables with X~ N(μ, o) and Y~ N(y, o). Consider U = X + Y…
A:
Q: Assessing Statistical Independence in a Categorical Data Set Answer C & D
A: (c) Given observed cross tabulation data is: Male Female Total live in school district≥5 125…
Q: In preparation for the upcoming school year, a teacher looks at raw test scores on the statewide…
A:
Q: The data (partially shown below) collected information about the house price and square foota of…
A: We have to right the steps for drawing histogram of the given dataset. Sqft Houseprice 1520…
Q: A study was conducted to determine if a new weight loss pill is effective. The null hypothesis is…
A: given data H0 : μ = 0Ha : μ > 0 n = 100 x¯ = 4σ = 2
Q: a. Using the pairs of values for all 10 points, find the equation of the regression line. b. After…
A: From scatter plot : Points are : (x,y) = (2,8) , (5,3) , (5,4) , (5,5) , (6,3), (6,4), (6,5) ,…
Q: Find the area under the standard normal curve to the right of =z−2.71 . (b) Find the area under…
A: Answer:- Using formula, P(Z > x) = 1- P(Z<x) P(a <Z <b) = P(Z<b) - P(Z<a)
Q: The command t.test(x,y) can be used for testing null hypothesis Ho:HA #HB O True False
A: Given that We have to find whether the statement is TRUE or FALSE t.test(x,y) can be used for…
Q: If the preceding scores are sample data, the sum of squares (SS) is the sum of squared deviations.)…
A: Given that, the data set contains 8 observations. Mean = 93 The sums of the observations and squares…
Q: If Y is a random variable with a mean of 10 and a standard deviation of 2, what is the probability…
A: From the provided information, Mean (µ) = 10 Standard deviation (σ) = 2
Q: Assignments ▸ Suppose a simple random sample of size n=1000 is obta.. Suppose a simple random sample…
A: Given that n=1000, p=0.76
Q: Task-4. What is normal, positively, and negatively skewed frequency distribution? Accordingly, what…
A: The question is about frequency distribution Introduction : Frequency Distribution : 1 ) The freq.…
Q: A marketing research company wants to determine if there is a difference in the mean satisfaction…
A: Given information n1=n2=100, sample mean x̄1=4.6, sample mean x̄2=4.5, standard deviation s1=s2=0.8…
Q: A box contains a shipment of n(n>4) computer chips, of which four are defective. Four chips are…
A:
Q: 4. Computing probability from a frequency distribution A bucket contains N = 11 tickets with…
A: X 1 2 3 4 5 P(X) 311 211 111 211 311
Q: 12. The cdf of a continuous random variable X is given by (0 x 1 Find the pdf and [Ans.: 0.195]
A: We have given that Cdf 0 , x<1 F(x)= x2 , 0<x<1 X…
Q: At a certain college, 17% of all students come from outside the country of that college. Incoming…
A: From the provided information, At a certain college, 17% of all students come from outside the…
Q: Consider a discrete random variable X that takes values 0, 1, 2, 3, 4, 5, with probabilities 0.1,…
A: Answer: The expected value of X is calculated as the sum of the product of each value of X and its…
Q: In the equation for computing the standard deviation, n represents what? a. the average b. the mean…
A: Given that Formula for standard deviations Sd=√{∑(x- x̄)/n}
Q: Golfing for a Long Life? A recent quote¹ on an online health site tells us "golfers' average life…
A: The quote was given that golfers' average life expectancy was 5 years longer than other people's The…
Q: Based on the following measures of central tendency, this distrubtion is normal. Median = 130 Mode =…
A: We have given that, Based on the measure of central tendency, this distribution is normal where,…
Q: Suppose the accompanying summary statistics for a measure of social marginality for samples of…
A:
Q: 3 2 3 4 сл 5 6 7 8 Five multiple-choice questions, each with four possible answers, appear on your…
A:
Q: If X is a random variable with a mean of 20 and a standard deviation of 5, what is the probability…
A: From the provided information, Mean (µ) = 20 Standard deviation (σ) = 5
Q: A stock has had returns of 17.92 percent, 12.44 percent, 6.56 percent, 28.30 percent, and −14.09…
A: First change percentage in probability by dividing 100. P1 = 0.1792 P2=0.1244 P3 = 0.656 P4 = 0.283…
Q: An electrician applied for a job in Long Harbour, Muskrat Falls, & Voisey’s Bay. According to a…
A: Let L denotes an electrician applied for a job in Long Harbour. M denotes an electrician applied for…
Q: i need help with 7
A: Here, we have given that Sample size (n) = 100 Number of success (x) = 50
Q: A plot of the residuals and frequencies is commonly called a
A: When there is an association between two variables, one variable may be expressed as a function of…
Q: Which of the following numbers could be the probability of an event? 0.07, -0.53, 1, 0.28, 0, 1.54…
A: From the provided information, The numbers are as follow: 0.07, -0.53, 1, 0.28, 0, 1.54
Q: Michelle, a telemarketer makes six phone calls per hour and is able to make a sale on 30% of these…
A: The question is about discrete probability distribution Given : No. phone call telemarketers makes…
Q: In a Mann-Whitney test, a researcher wants to compare the difference between two independent groups,…
A: Given that: Sample size of group A, n1=50 Sample size of group B, n2=40 Test statistic, U=120
Q: According to the Production and Use of Oil graph, during which period did oil production and use…
A: Introduction A statistical graph is used for representing the data to make it easier to draw…
Q: Suppose Y is a random variable with a normal distribution and mean (μ) equal to 100, and standard…
A: GivenA random variable Y ~Normal(100,15)Mean(μ)=100standard deviation(σ)=15
Q: Consider the table below taken from a sample of legislators. What is the probability that a…
A: trade AGT republican democrat Total in favor 10 9 19 against 9 1 10 Total 19 10 29
4. You can be charged with “Motor Vehicle Impairment” if your Blood Alcohol Level (BAL) is 0.08 or more. The following is a Frequency Distribution of the BAL of 98 individuals who were charged with impairment.
Calculate the mean (BAL) of individuals charged with impairment and the standard deviation of this Frequency Distribution (ie. Grouped Data)
*Picture posted

Step by step
Solved in 2 steps with 2 images

- The human resources director of a large company recently asked her staff to conduct a study of the airline miles traveled by executives of the company during the most recent calendar year. The analyst assigned to the project randomly sampled 25 male executives and 25 female executives. Of particular interest to the HR director is whether males have greater variability in miles flown than females. The statistics available below were computed from the samples. Based on these data, what should the HR director conclude if an alpha level equal to 0.01 is used? LOADING... Click the icon to view the statistics about the number of miles flown. Males Females Mean Miles 73,262 66,888 St. Deviation Miles 2,568 1,539 Sample Size 25 25 Let sample 1 be males and sample 2 be females. What are the null and alternative hypotheses? A. H0: σ21=σ22 HA: σ21≠σ22 B. H0: σ21≤σ22 HA: σ21>σ22 C. H0: σ21≥σ22 HA:…Serum estradiol is an important risk factor for breast cancer in postmenopausal women. To better understand the etiology of breast cancer, serum-estradiol samples were collected from 25 premenopausal women (at about the same time period of the menstrual cycle) of whom 10 were Caucasian and 15 were African American. The data are shown in Table 7.3. The distribution of serum estradiol is usually highly skewed (especially for premenopausal women), and we are reluctant to assume normality. Table 7.3 Serum estradiol and ethnicity in 25 premenopausal women, where 0=Caucasian and 1=African-American ID Serum_estradiol Ethic 1 94 0 2 54 1 3 31 0 4 21 1 5 46 1 6 56 0 7 18 1 8 19 1 9 12 1 10 14 0 11 25 0 12 35 1 13 22 1 14 71 0 15 43 1 16 35 1 17 42 1 18 50 1 19 44 1 20 41 0 21 28 0 22 65 0 23 31 0 24…Serum estradiol is an important risk factor for breast cancer in postmenopausal women. To better understand the etiology of breast cancer, serum-estradiol samples were collected from 25 premenopausal women (at about the same time period of the menstrual cycle) of whom 10 were Caucasian and 15 were African American. The data are shown in Table 7.3. The distribution of serum estradiol is usually highly skewed (especially for premenopausal women), and we are reluctant to assume normality. Table 7.3 Serum estradiol and ethnicity in 25 premenopausal women, where 0=Caucasian and 1=African-American. ID Serum_estradiol Ethic 1 94 0 2 54 1 3 31 0 4 21 1 5 46 1 6 56 0 7 18 1 8 19 1 9 12 1 10 14 0 11 25 0 12 35 1 13 22 1 14 71 0 15 43 1 16 35 1 17 42 1 18 50 1 19 44 1 20 41 0 21 28 0 22 65 0 23 31 0 24…
- Serum estradiol is an important risk factor for breast cancer in postmenopausal women. To better understand the etiology of breast cancer, serum estradiol samples were collected from 25 menopausal women ( at about the same time period of the menstrual cycle) of whom 10 were Caucasion and 15 were African American. The data are shown in Table 7.3. The distribution of serum estradiol is usually high skewed ( especially for premenopausal women), and we are reluctant to assume normality. Table 7.3 Serum estradiol and ethnicity in 25 premenopausal women, where 0=Caucasian and 1=African-American ID Serum_estradiol Ethic 1 94 0 2 54 1 3 31 0 4 21 1 5 46 1 6 56 0 7 18 1 8 19 1 9 12 1 10 14 0 11 25 0 12 35 1 13 22 1 14 71 0 15 43 1 16 35 1 17 42 1 18 50 1 19 44 1 20 41 0 21 28 0 22 65 0 23 31 0 24 35…Serum estradiol is an important risk factor for breast cancer in postmenopausal women. To better understand the etiology of breast cancer, serum estradiol samples were collected from 25 menopausal women ( at about the same time period of the menstrual cycle) of whom 10 were Caucasion and 15 were African American. The data are shown in Table 7.3. The distribution of serum estradiol is usually high skewed ( especially for premenopausal women), and we are reluctant to assume normality. Table 7.3 Serum estradiol and ethnicity in 25 premenopausal women, where 0=Caucasian and 1=African-American ID Serum_estradiol Ethic 1 94 0 2 54 1 3 31 0 4 21 1 5 46 1 6 56 0 7 18 1 8 19 1 9 12 1 10 14 0 11 25 0 12 35 1 13 22 1 14 71 0 15 43 1 16 35 1 17 42 1 18 50 1 19 44 1 20 41 0 21 28 0 22 65 0 23 31 0 24 35…Chang et al. in 2005 examined the association between a family history of hematopoietic cancer on an individual’s risk of lymphoma in Sweden. In this study, the investigators validated self-report of a family history by searching for family members’ diagnosis in the Swedish Cancer Registry and examined whether the validity of self-report differed between cases and controls. Use the information contained in the tables below to answer the accompany questions: Assuming the following table displays the true distribution of exposure among cases and controls, construct a new table with misclassification of exposure if sensitivity and specificity are 60% and 98% among cases; and 38% and 99% among the controls respectively. True Distribution Cases Control Family history 56.7 37.1 No family history 1148.3 1189.9 Compute the true ORT using the information from the table above. Complete the observed or misclassified table below Observed / Misclassified…
- Aortic stenosis refers to a narrowing of the aortic valvein the heart. The article “Correlation Analysis ofStenotic Aortic Valve Flow Patterns Using PhaseContrast MRI” (Annals of Biomed. Engr., 2005:878–887) gave the following data on aortic root diameter(cm) and gender for a sample of patients having variousdegrees of aortic stenosis:M: 3.7 3.4 3.7 4.0 3.9 3.8 3.4 3.6 3.1 4.0 3.4 3.8 3.5F: 3.8 2.6 3.2 3.0 4.3 3.5 3.1 3.1 3.2 3.0a. Compare and contrast the diameter observations forthe two genders.b. Calculate a 10% trimmed mean for each of the twosamples, and compare to other measures of center(for the male sample, the interpolation method mentionedin Section 1.3 must be used).A researcher is trying to determine if there is a significant relationship between number of hours spent cycling each week and resting heart rate among study participants. Which procedure should he use? Group of answer choices: Mean ANOVA One-way chi square CorrelationThompson & Thompson Inc. has decided to use an R-Chart to monitor the changes in the variability of their 0.33 inch metal shafts. The production manager randomly samples 8 metal shafts and measures the diameter of the sample (in inches) at 14 successive time periods. Period obs1 obs2 obs3 obs4 obs5 obs6 obs7 obs8 Sample Range1 0.33 0.34 0.37 0.28 0.31 0.31 0.30 0.35 0.092 0.35 0.38 0.37 0.36 0.33 0.30 0.36 0.28 0.103 0.32 0.36 0.33 0.37 0.33 0.34 0.30 0.36 0.074 0.36 0.33 0.29 0.37 0.32 0.35 0.30 0.38 0.095 0.38 0.34 0.31 0.35 0.29 0.30 0.38 0.37 0.096 0.38 0.33 0.30 0.36 0.37 0.36 0.29 0.32 0.097 0.31 0.29 0.32 0.35 0.38 0.37 0.29 0.33 0.098 0.36 0.34 0.38 0.29 0.34 0.34 0.35 0.36 0.099 0.33 0.36 0.31 0.34 0.29 0.35 0.30 0.31 0.0710 0.38 0.30 0.33 0.33 0.37 0.29 0.33 0.30 0.0911 0.38 0.33 0.35 0.32 0.34 0.28 0.31 0.31 0.1012 0.34 0.31 0.38 0.29 0.36 0.37 0.29 0.35 0.0913 0.32 0.32 0.33 0.31 0.28 0.33 0.36 0.36 0.0814 0.37 0.29 0.29 0.29 0.31 0.35 0.31 0.33 0.08 What is the Center…