4.1 If real GDP in a small country in 2017 is $8 billion and real GDP in the same country in 2018 is $8.3 billion, the growth rate of real GDP between 2017 and 2018. Show your work
4.1 If real GDP in a small country in 2017 is $8 billion and real GDP in the same country in 2018 is $8.3 billion, the growth rate of real GDP between 2017 and 2018. Show your work

Chapter21: Financial Markets, Saving, And Investment
Section: Chapter Questions
Problem 9P

Related questions
Question
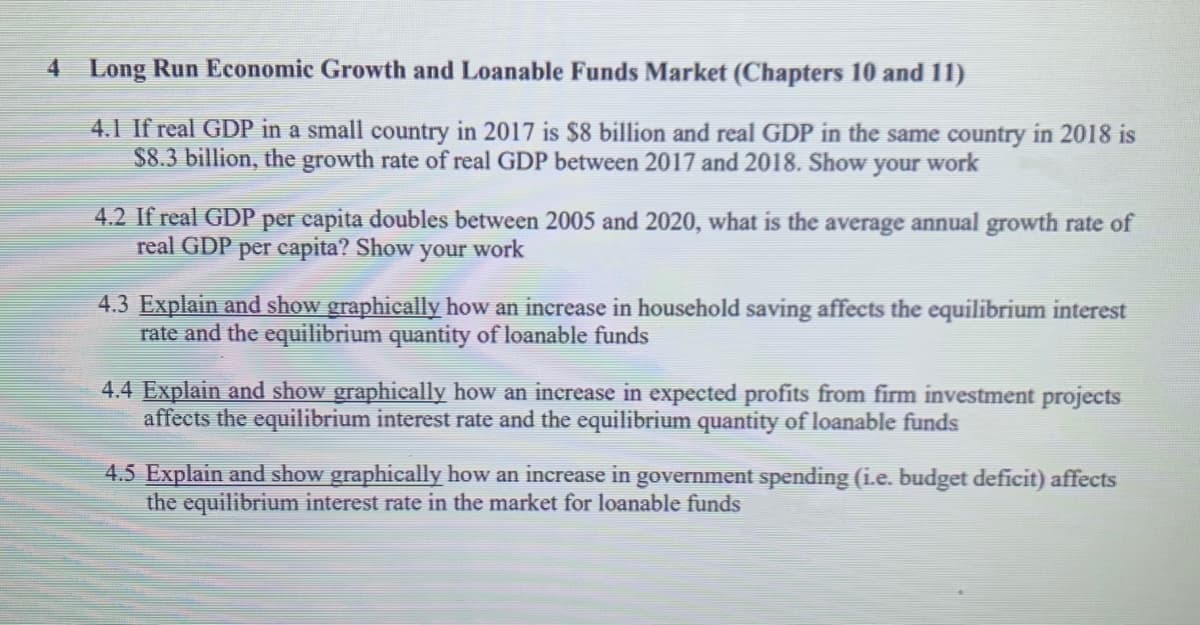
Transcribed Image Text:4 Long Run Economic Growth and Loanable Funds Market (Chapters 10 and 11)
4.1 If real GDP in a small country in 2017 is $8 billion and real GDP in the same country in 2018 is
$8.3 billion, the growth rate of real GDP between 2017 and 2018. Show your work
4.2 If real GDP per capita doubles between 2005 and 2020, what is the average annual growth rate of
real GDP per capita? Show your work
4.3 Explain and show graphically how an increase in household saving affects the equilibrium interest
rate and the equilibrium quantity of loanable funds
4.4 Explain and show graphically how an increase in expected profits from firm investment projects
affects the equilibrium interest rate and the equilibrium quantity of loanable funds
4.5 Explain and show graphically how an increase in government spending (ie. budget deficit) affects
the equilibrium interest rate in the market for loanable funds
Expert Solution
This question has been solved!
Explore an expertly crafted, step-by-step solution for a thorough understanding of key concepts.

This is a popular solution!

Trending now
This is a popular solution!

Step by step
Solved in 2 steps

Knowledge Booster


Learn more about
Need a deep-dive on the concept behind this application? Look no further. Learn more about this topic, economics and related others by exploring similar questions and additional content below.Recommended textbooks for you
Exploring Economics
Economics
ISBN:
9781544336329
Author:
Robert L. Sexton
Publisher:
SAGE Publications, Inc

Essentials of Economics (MindTap Course List)
Economics
ISBN:
9781337091992
Author:
N. Gregory Mankiw
Publisher:
Cengage Learning

Brief Principles of Macroeconomics (MindTap Cours…
Economics
ISBN:
9781337091985
Author:
N. Gregory Mankiw
Publisher:
Cengage Learning
Exploring Economics
Economics
ISBN:
9781544336329
Author:
Robert L. Sexton
Publisher:
SAGE Publications, Inc
Essentials of Economics (MindTap Course List)
Economics
ISBN:
9781337091992
Author:
N. Gregory Mankiw
Publisher:
Cengage Learning
Brief Principles of Macroeconomics (MindTap Cours…
Economics
ISBN:
9781337091985
Author:
N. Gregory Mankiw
Publisher:
Cengage Learning

Principles of Economics 2e
Economics
ISBN:
9781947172364
Author:
Steven A. Greenlaw; David Shapiro
Publisher:
OpenStax