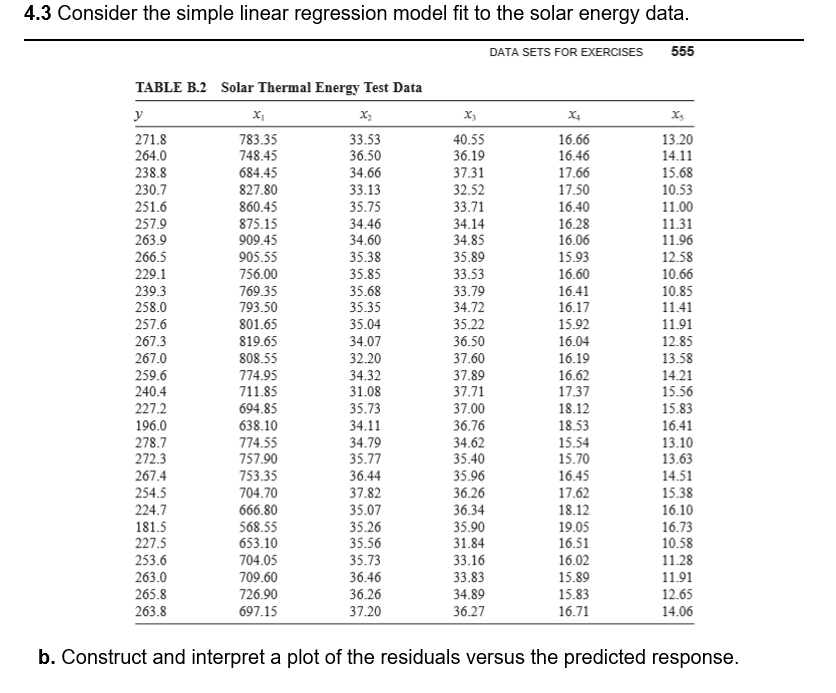
4.3 Consider the simple linear regression model fit to the solar energy data. DATA SETS FOR EXERCISES 555 TABLE B.2 Solar Thermal Energy Test Data y x₁ X₂ X3 X4 xs 271.8 783.35 33.53 40.55 16.66 13.20 264.0 748.45 36.50 36.19 16.46 14.11 238.8 684.45 34.66 37.31 17.66 15.68 230.7 827.80 33.13 32.52 17.50 10.53 251.6 860.45 35.75 33.71 16.40 11.00 257.9 875.15 34.46 34.14 16.28 11.31 263.9 909.45 34.60 34.85 16.06 11.96 266.5 905.55 35.38 35.89 15.93 12.58 229.1 756.00 35.85 33.53 16.60 10.66 239.3 769.35 35.68 33.79 16.41 10.85 258.0 793.50 35.35 34.72 16.17 11.41 257.6 801.65 35.04 35.22 15.92 11.91 267.3 819.65 34.07 36.50 16.04 12.85 267.0 808.55 32.20 37.60 16.19 13.58 259.6 774.95 34.32 37.89 16.62 14.21 240.4 711.85 31.08 37.71 17.37 15.56 227.2 694.85 35.73 37.00 18.12 15.83 196.0 638.10 34.11 36.76 18.53 16.41 278.7 774.55 34.79 34.62 15.54 13.10 272.3 757.90 35.77 35.40 15.70 13.63 267.4 753.35 36.44 35.96 16.45 14.51 254.5 704.70 37.82 36.26 17.62 15.38 224.7 666.80 35.07 36.34 18.12 16.10 181.5 568.55 35.26 35.90 19.05 16.73 227.5 653.10 35.56 31.84 16.51 10.58 253.6 704.05 35.73 33.16 16.02 11.28 263.0 709.60 36.46 33.83 15.89 11.91 265.8 726.90 36.26 34.89 15.83 12.65 263.8 697.15 37.20 36.27 16.71 14.06 b. Construct and interpret a plot of the residuals versus the predicted response.
4.3 Consider the simple linear regression model fit to the solar energy data. DATA SETS FOR EXERCISES 555 TABLE B.2 Solar Thermal Energy Test Data y x₁ X₂ X3 X4 xs 271.8 783.35 33.53 40.55 16.66 13.20 264.0 748.45 36.50 36.19 16.46 14.11 238.8 684.45 34.66 37.31 17.66 15.68 230.7 827.80 33.13 32.52 17.50 10.53 251.6 860.45 35.75 33.71 16.40 11.00 257.9 875.15 34.46 34.14 16.28 11.31 263.9 909.45 34.60 34.85 16.06 11.96 266.5 905.55 35.38 35.89 15.93 12.58 229.1 756.00 35.85 33.53 16.60 10.66 239.3 769.35 35.68 33.79 16.41 10.85 258.0 793.50 35.35 34.72 16.17 11.41 257.6 801.65 35.04 35.22 15.92 11.91 267.3 819.65 34.07 36.50 16.04 12.85 267.0 808.55 32.20 37.60 16.19 13.58 259.6 774.95 34.32 37.89 16.62 14.21 240.4 711.85 31.08 37.71 17.37 15.56 227.2 694.85 35.73 37.00 18.12 15.83 196.0 638.10 34.11 36.76 18.53 16.41 278.7 774.55 34.79 34.62 15.54 13.10 272.3 757.90 35.77 35.40 15.70 13.63 267.4 753.35 36.44 35.96 16.45 14.51 254.5 704.70 37.82 36.26 17.62 15.38 224.7 666.80 35.07 36.34 18.12 16.10 181.5 568.55 35.26 35.90 19.05 16.73 227.5 653.10 35.56 31.84 16.51 10.58 253.6 704.05 35.73 33.16 16.02 11.28 263.0 709.60 36.46 33.83 15.89 11.91 265.8 726.90 36.26 34.89 15.83 12.65 263.8 697.15 37.20 36.27 16.71 14.06 b. Construct and interpret a plot of the residuals versus the predicted response.

Functions and Change: A Modeling Approach to College Algebra (MindTap Course List)
6th Edition
ISBN:9781337111348
Author:Bruce Crauder, Benny Evans, Alan Noell
Publisher:Bruce Crauder, Benny Evans, Alan Noell
Chapter3: Straight Lines And Linear Functions
Section3.4: Linear Regression
Problem 12SBE: Find the equation of the regression line for the following data set. x 1 2 3 y 0 3 4

Related questions
Question
Transcribed Image Text:4.3 Consider the simple linear regression model fit to the solar energy data.
DATA SETS FOR EXERCISES 555
TABLE B.2 Solar Thermal Energy Test Data
y
x₁
X₂
X3
X4
Xs
271.8
783.35
33.53
40.55
16.66
13.20
264.0
748.45
36.50
36.19
16.46
14.11
238.8
684.45
34.66
37.31
17.66
15.68
230.7
827.80
33.13
32.52
17.50
10.53
251.6
860.45
35.75
33.71
16.40
11.00
257.9
875.15
34.46
34.14
16.28
11.31
263.9
909.45
34.60
34.85
16.06
11.96
266.5
905.55
35.38
35.89
15.93
12.58
229.1
756.00
35.85
33.53
16.60
10.66
239.3
769.35
35.68
33.79
16.41
10.85
258.0
793.50
35.35
34.72
16.17
11.41
257.6
801.65
35.04
35.22
15.92
11.91
267.3
819.65
34.07
36.50
16.04
12.85
267.0
808.55
32.20
37.60
16.19
13.58
259.6
774.95
34.32
37.89
16.62
14.21
240.4
711.85
31.08
37.71
17.37
15.56
227.2
694.85
35.73
37.00
18.12
15.83
196.0
638.10
34.11
36.76
18.53
16.41
278.7
774.55
34.79
34.62
15.54
13.10
272.3
757.90
35.77
35.40
15.70
13.63
267.4
753.35
36.44
35.96
16.45
14.51
254.5
704.70
37.82
36.26
17.62
15.38
224.7
666.80
35.07
36.34
18.12
16.10
181.5
568.55
35.26
35.90
19.05
16.73
227.5
653.10
35.56
31.84
16.51
10.58
253.6
704.05
35.73
33.16
16.02
11.28
263.0
709.60
36.46
33.83
15.89
11.91
265.8
726.90
36.26
34.89
15.83
12.65
263.8
697.15
37.20
36.27
16.71
14.06
b. Construct and interpret a plot of the residuals versus the predicted response.
Expert Solution
This question has been solved!
Explore an expertly crafted, step-by-step solution for a thorough understanding of key concepts.

This is a popular solution!

Trending now
This is a popular solution!

Step by step
Solved in 2 steps with 1 images

Recommended textbooks for you
Functions and Change: A Modeling Approach to Coll…
Algebra
ISBN:
9781337111348
Author:
Bruce Crauder, Benny Evans, Alan Noell
Publisher:
Cengage Learning

Glencoe Algebra 1, Student Edition, 9780079039897…
Algebra
ISBN:
9780079039897
Author:
Carter
Publisher:
McGraw Hill

Functions and Change: A Modeling Approach to Coll…
Algebra
ISBN:
9781337111348
Author:
Bruce Crauder, Benny Evans, Alan Noell
Publisher:
Cengage Learning
Glencoe Algebra 1, Student Edition, 9780079039897…
Algebra
ISBN:
9780079039897
Author:
Carter
Publisher:
McGraw Hill

Linear Algebra: A Modern Introduction
Algebra
ISBN:
9781285463247
Author:
David Poole
Publisher:
Cengage Learning

Algebra & Trigonometry with Analytic Geometry
Algebra
ISBN:
9781133382119
Author:
Swokowski
Publisher:
Cengage

College Algebra
Algebra
ISBN:
9781305115545
Author:
James Stewart, Lothar Redlin, Saleem Watson
Publisher:
Cengage Learning