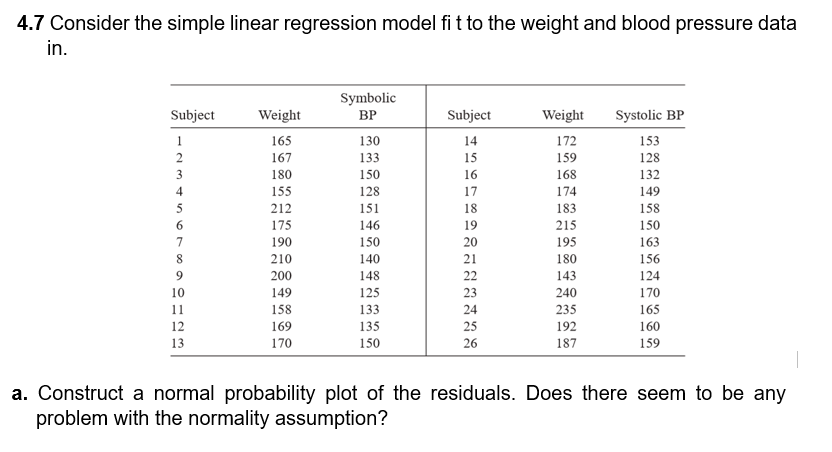
4.7 Consider the simple linear regression model fit to the weight and blood pressure data in. Symbolic BP Subject Weight Subject Weight Systolic BP 1 165 130 14 172 153 2 167 133 15 159 128 3 180 150 16 168 132 4 155 128 17 174 149 5 212 151 18 183 158 6 175 146 19 215 150 7 190 150 20 195 163 8 210 140 21 180 156 9 200 148 143 124 10 149 125 240 170 11 158 133 235 165 12 169 135 25 192 160 13 170 150 26 187 159 a. Construct a normal probability plot of the residuals. Does there seem to be any problem with the normality assumption? เสีสสสสส 22 23 24
Q: You want to obtain a sample to estimate a population proportion. Based on previous evidence, you…
A:
Q: Consider a factorial design experiment whose inputs number is 5 and levels number is 2. a) How many…
A: Since you have posted a question with multiple sub-parts, we will solve the first three sub-parts…
Q: A random sample of 400 men from one stage gives the mean pay of Rs. 200 per day with a standard…
A:
Q: Car Mazda RX4 Mazda RX4 Wag Datsun 710 Hornet 4 Drive Hornet Sportabout Chrysler Valiant mpg 21 21…
A: To estimate the population in a typical research study for a particular degree of accuracy the…
Q: A rivet is to be inserted into a hole. A random sample of 15 parts is selected, and the hole…
A: The sample standard deviation (s)=0.008 The variance of the sample (s2)=0.0082=0.000064 Sample…
Q: Question 3 A sample of 44 commuters in Chicago showed the average of the commuting times was 33.2…
A: "Since you have asked multiple questions, we'll solve the first question for you. If you want any…
Q: 6.. Let X₁, X2,..., Xn denote a random sample from a Bernoulli distribution with parameter p. Find a…
A:
Q: Testing Hypothesis A company that makes cola drinks states that the mean caffeine content per 12-…
A:
Q: Males 2-11 Females 2-11 Males 12-17 Females 12-17 Males 18-34 Females 18-34 Males 35-49 Females…
A: Given data, Gender and Age grou[ Relative frequency Males 2-11 0.134 Females 2-11 0.116…
Q: STATISTICS AND PROBABILITY (Answer only. NO long explanation needed. Rate will be given) What is…
A:
Q: A team of engineers at the research center of a car manufacturer performs crash tests to determine…
A: Solution:- from given information Null hypothesis H0:p=0.08Alternate hypothesis…
Q: At a large university, 80% of all students live on campus. Suppose a random selected from this…
A: At a large university 80% of all students live on campus; p=0.80 A random sample of 218 students is…
Q: Find the multiple regression model of the given data: A y B с D E F 8.0 19.6 94.9 5.2 2.3 2.1 29.6…
A: Solution: From the given information,
Q: The weights of a large number of miniature poodles are approximately normally distributed with a…
A: Given Mean=8.2 Standard deviations=0.80
Q: 3. Powder milk is packed in 1-kilogram. An inspector from the Department of Trade and Industry (DTI)…
A: It is given that: x¯ sample average weight=0.96n sample size=40s sample SD=0.12μ0 claimed weight at…
Q: #3. Choose the letter of the correct answer. An ogive is a graphical representation of a. Cumulative…
A: The objective is to find the correct option from the given choices.
Q: Root_lenght Treatment Root_lenght Treatmen t control 3dS 6dS 9dS 12dS Total Case Processing Summary…
A: Box plot is used to measure the normality or skewness of the data set. Box plot calculated using the…
Q: Advances in medical and technological innovations have led to the availability of numerous medical…
A: A random sample of 100 females; n=100 20% of the female respondents had the highest experience;…
Q: The following data gives the means of two samples taken from a population. Test whether there is any…
A: Given that: x¯=60y¯=59n1=100n2=200σ=50 Significance level, α=0.05
Q: Construct a relative frequency distribution. Round the answers to two decimal places. Response…
A:
Q: . If the points on the scatter graph follow a trend of rising from right to left, how will you…
A: Note : As per answering guidelines I have to only one question in case of multiple different…
Q: A mechanic a brand of automobile tire that has a expectancy that is normally distributedwith a mean…
A:
Q: The average price of a personal computer is $949. If the computer distributed with a standard…
A:
Q: - Let x be the mean of a random sample of size 50 drown from a population with mean 112 and andard…
A: Sample size(n)=50 Mean (μ)=112 Standard deviation(σ)=40
Q: Directions: Using the given values/parts of the test of hypothesis involving population, construct…
A: 1) Given: Significance level α=0.05 Null Hypothesis H0:p=0.6 Alternative Hypothesis Ha:p≠0.6 Topic:…
Q: A group of volleyball players consists of four grade-11 students and six grade-12 students. If six…
A: Probability is the chance of occurrence of an event.
Q: Construct a word problem guided by the table below (week in hours and body mass index (BMI)…
A: Correlation is a method of statistical analysis and it widely used in analysis. Correlation measures…
Q: Which set of data would probably show a strong negative linear correlation? a) resale values of…
A: The correlation coefficient is mainly computed to know the type of relationship that lies between…
Q: 1. Statistics and Probability students had their 50-item quiz. Given the mean score of the students…
A: The provided information is µ=35 σ=6 n=50…
Q: 2. It is known from the records of the city schools that the standard deviation of Math test scores…
A: Given : sample size, n =200 sample mean, x̄ =75 population standard deviation,σ=15…
Q: The heights of Susa, Ada, and Rhea were 155 cm, 158 cm, and 161 cm, respectively. What is the height…
A: From the provided information, The mean of four girls = 158 cm The height of Susa, Ada, and Rhea…
Q: STATISTICS AND PROBABILITY (Answer only. NO long explanation needed. Rate will be given) Find the…
A:
Q: You want to analyze the travel-to-work time for Daly City residents. Suppose that a preliminary…
A: The following information has been given: The population standard deviation is σ=10 The sample size…
Q: Samples of two types of electric light bulbs were tested for the length of life and following data…
A: Hypothesis testing is an inferential statistical procedure.
Q: a. Ecobank Ghana has recently examined the credit card account balances of its customers and found…
A: Please note that as per our guidelines if multiple questions are posted we can answer the first…
Q: in a standard normal distribution, P(–2.1 < Z < 1.9) =
A:
Q: Assignment Carlos wants to replicate a study where the highest lowest observed value is 13.8 while…
A: given data
Q: STATISTICS AND PROBABILITY (Answer only. NO long explanation needed. Rate will be given) ANSWER IN…
A:
Q: For regress problems how do you find the R squared Value? Regress Y on X1, X2, X3, X4 and X5
A: Y on X1, X2, X3, X4, X5 is model of multiple regression. Here model will be framed as multiple…
Q: Question 7 For the following information x 43 48 56 61 128 120 y 135 143 (a) Estimate the sample…
A: Note: As per guidelines we are supposed to solve only first three subparts. Please repost the other…
Q: Given the following data of 26 observations: X Y X Y 165 130 172 153 167 133 159 128 180 150 168 132…
A: Hi there! Thanks for posting the question. Since there are multiple subparts we will solve first…
Q: 7. What is the median score achieved by a student who recorded the following scores on 10 math…
A: Formula : Median= (5th observation + 6th observation) /2
Q: The following table shows the annual family income of the students enrolled in the JRMSU-TC and…
A: Excel procedure to plot regression line: Enter the data in an excel sheet. Select the data of two…
Q: Statistical Analysis - Data Management For the following graph, answer the following: mean,…
A: Since you have posted a question with multiple sub-parts, we will solve the first three sub-parts…
Q: a. Describe the sampling distribution of Choose the correct answer below. OA. The sampling…
A: It is given that The null and alternative hypotheses are: H0: μ = 66 H1: μ > 66 n = 415, σ…
Q: Assign Temperature to be factor affecting Proportion of Impurities Temperature (°C) Proportion of…
A: For the given data Select the correct choice
Q: A postmix beverage machine is adjusted to release a certain amount of syrup into a chambe where it…
A: Formula : CI=point estimate ± ME
Q: If 3 books are picked at random from a shelf containing 5 novels, 3 books of poems and a dictionary,…
A: There are total 9 books on the shelf. The total ways is C(9,3) =9!(9-3)!*3!=84 ways We pick up 2…
Q: II. Complete the table below. Use z-Critical Value Table or t-Critical Value Table. Type of Test a…
A: Explanation: 1. Type of test: Two tailed. Significance level α = 0.01 Sample size n = 15 Computed…
Q: The test scores for the analytical writing section of a particular standardized test can be…
A: The mean is 3.7 and the standard deviation is 0.92.
Step by step
Solved in 2 steps with 1 images
- The following is part of the computer output from a regression of monthly returns on Waterworks stock against the S&P 500 Index. A hedge fund manager believes that Waterworks is underpriced, with an alpha of 2% over the coming month. Beta R-square Standard Deviationof Residuals 0.75 0.65 0.06 (i.e., 6% monthly) Now suppose that the manager misestimates the beta of Waterworks stock, believing it to be 0.50 instead of 0.75. The standard deviation of the monthly market rate of return is 5%. Required: a. If he holds a $6 million portfolio of Waterworks stock and wishes to hedge market exposure for the next month using one-month maturity S&P 500 futures contracts, what is the standard deviation of the (now improperly) hedged portfolio? The S&P 500 currently is at 3,000 and the contract multiplier is $50. (Do not round intermediate calculations. Round your percentage answer to 2 decimal places.) b. What is the probability of incurring a loss over the next month…A snack food manufacturer estimates that the variance of the number of grams of carbohydrates in servings of its tortilla chips is 1.34. A dietician is asked to test this claim and finds that a random sample of 16 servings has a variance of 1.22. At α=0.05, is there enough evidence to reject the manufacturer's claim? Assume the population is normally distributed. Complete parts (a) through (e) below.A snack food manufacturer estimates that the variance of the number of grams of carbohydrates in servings of its tortilla chips is 1.33. A dietician is asked to test this claim and finds that a random sample of 24 servings has a variance of 1.37. At α=0.01, is there enough evidence to reject the manufacturer's claim? Assume the population is normally distributed. Complete parts (a) through (e) below. (a) Write the claim mathematically and identify H0 and Ha. A. H0: σ2≤1.33 (Claim) Ha: σ2>1.33 B. H0: σ2≠1.33 Ha: σ2=1.33 (Claim) C. H0: σ2≥1.33 Ha: σ2<1.33 (Claim) D. H0: σ2=1.33 (Claim) Ha: σ2≠1.33 (b) Find the critical value(s) and identify the rejection region(s). The critical value(s) is(are) enter your response here. (Round to two decimal places as needed. Use a comma to separate answers as needed.) Choose the correct statement below and fill in the corresponding answer boxes. A. The…
- Suppose that a sample of n = 12 pairs of X and Y scores has SSY = 90 and a Pearson correlation of r = +0.40. Does the regression equation predict a significant portion of the variance? Test with α = .05.(hint: SStotal = SSY; r2 = SSregression/SSTotal)A researcher conducts an independent- measures research study and obtains t = 2.070 with df = 28. How many individuals participated in the entire research study? Using a two- tailed test with α = .05, is there a significant difference between the two treatment conditions? Compute r2 to measure the percentage of variance accounted for by the treatment effect.In a sample of 12 randomly selected high school seniors, the mean score on a standardized test was 1200 and the standard deviation was 160.5. Further research suggests that the population mean score on this test for high school seniors is 1016. Does the t-value for the original sample fall between −t0.90 and t0.90? Assume that the population of test scores for high school seniors is normally distributed.
- Which of the following can cause the usual OLS t statistics to be invalid (that is, not to have t distributions under H0)?(i) Heteroskedasticity.(ii) A sample correlation coefficient of .95 between two independent variables that are in the model.(iii) Omitting an important explanatory variable.A sample of n = 120 scores were presented using the Tenacity (authority) scores to the following predictors: age gender, SES, tone of voice, and clothing. Using a two-tailed test at the 0.05 level of significance, a multiple regression analysis was computed: 1. tenacity and age (pvalue = 0.043); 2. tenacity and gender (pvalue = 0.102); 3. tenacity and SES (pvalue = 0.40); 4. tenacity and voice (pvalue = 0.001); 5. tenacity and clothing (value = 0.017); SOrs Using the pvalue, provide your DECISION, whether:Accept Ho or Reject Ho, Accept HaA snack food manufacturer estimates that the variance of the number of grams of carbohydrates in servings of its tortilla chips is 1.25. A dietician is asked to test this claim and finds that a random sample of 22 servings has a variance of 1.35. At ⍶ = 0.05 is there enough evidence to reject the manufacturer’s claim?
- The random sample of 7 pairs of observations from the normal population gives the following information:- x 8 1 3 6 12 7 10 y 13 30 23 35 24 18 15 [ r = -0.459 and take the significance level (alpha) = 0.02] The P - Value of the test statistic ( along with decision ) used for testing that the two variables are not linearly related ( H(null) : roll = 0) isA snack food manufacturer estimates that the variance of the number of grams of carbohydrates in servings of its tortilla chips is 1.141.14. A dietician is asked to test this claim and finds that a random sample of 2424 servings has a variance of 0.950.95. At alpha equals 0.10α=0.10, is there enough evidence to reject the manufacturer's claim? Assume the population is normally distributed.Given are five observations for two variables, x and y. xi 2 7 15 18 20 yi 60 51 42 12 14 Use the estimated regression equation: y^=68.5866-2.6441 . a. Compute the mean square error using equation. (to 4 decimals) b. Compute the standard error of the estimate using equation. (to 4 decimals) c. Compute the estimated standard deviation of b1 using equation. (to 4 decimals) d. Use the t-test to test the following hypotheses (a=0.05): Compute the value of the t-test statistic (Enter negative values as negative numbers). (to 3 decimals) What is the p-value? Use Table 2 from Appendix B. p-value is What is your conclusion? We (do not reject, reject). e. Use the F-test to test the hypotheses in part (d) at a 0.05 level of significance. Complete the F table below using Excel. Calculate the Sum of Squares (to 1 decimal), the Mean Squares (to 1 decimal), and the F ratio (to 2 decimals) and the p-value (to 4 decimals). Sourceof Variation Degreesof Freedom Sum ofSquares MeanSquare F…