4.35. A randomly selected sample of bicycle helmets was tested for impact resistance. Given the data results below, what is the 95% confidence interval for the mean bicycle helmet impact resistance? Test results: Sample size: 100 helmets Average impact resistance: 276 g Standard deviation of the measurements: 15 g a. 276 ± 29.4 g b. 276 ± 2.47 g c. 276 ± 2.94 g d. 276 ± 2.17 g
4.35. A randomly selected sample of bicycle helmets was tested for impact resistance. Given the data results below, what is the 95% confidence interval for the mean bicycle helmet impact resistance? Test results: Sample size: 100 helmets Average impact resistance: 276 g Standard deviation of the measurements: 15 g a. 276 ± 29.4 g b. 276 ± 2.47 g c. 276 ± 2.94 g d. 276 ± 2.17 g

MATLAB: An Introduction with Applications
6th Edition
ISBN:9781119256830
Author:Amos Gilat
Publisher:Amos Gilat
Chapter1: Starting With Matlab
Section: Chapter Questions
Problem 1P

Related questions
Question
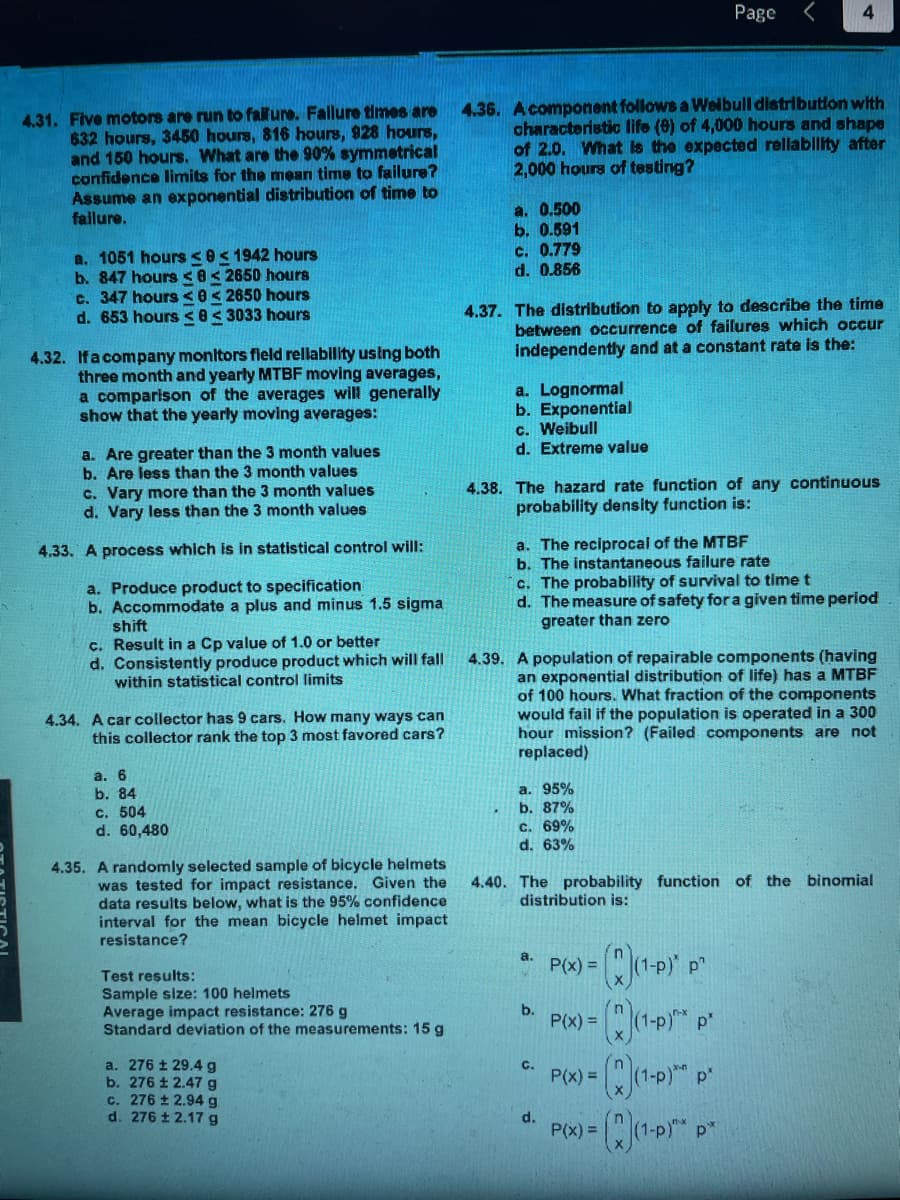
Transcribed Image Text:4.31. Five motors are run to failure. Failure times are
632 hours, 3450 hours, 816 hours, 928 hours,
and 150 hours. What are the 90% symmetrical
confidence limits for the mean time to failure?
Assume an exponential distribution of time to
failure.
a. 1051 hours <0 ≤ 1942 hours
b. 847 hours 82650 hours
c. 347 hours <0 2650 hours
d. 653 hours <83033 hours
4.32. If a company monitors field reliability using both
three month and yearly MTBF moving averages,
a comparison of the averages will generally
show that the yearly moving averages:
a. Are greater than the 3 month values
b. Are less than the 3 month values
c. Vary more than the 3 month values
d. Vary less than the 3 month values
4.33. A process which is in statistical control will:
a. Produce product to specification
b. Accommodate a plus and minus 1.5 sigma
shift
c. Result in a Cp value of 1.0 or better
d. Consistently produce product which will fall
within statistical control limits
4.34. A car collector has 9 cars. How many ways can
this collector rank the top 3 most favored cars?
a. 6
b. 84
c. 504
d. 60,480
4.35. A randomly selected sample of bicycle helmets
was tested for impact resistance. Given the
data results below, what is the 95% confidence
interval for the mean bicycle helmet impact
resistance?
Test results:
Sample size: 100 helmets
Average impact resistance: 276 g
Standard deviation of the measurements: 15 g
a. 276 ± 29.4 g
b. 276 ± 2.47 g
c. 276 ± 2.94 g
d. 276 ± 2.17 g
4.36.
a. 0.500
b. 0.591
4.39.
A component follows a Weibull distribution with
characteristic life (9) of 4,000 hours and shape
of 2.0. What is the expected reliability after
2,000 hours of testing?
c. 0.779
d. 0.856
4.37. The distribution to apply to describe the time
between occurrence of failures which occur
independently and at a constant rate is the:
a. Lognormal
b. Exponential
c. Weibull
d. Extreme value
4.38. The hazard rate function of any continuous
probability density function is:
a. The reciprocal of the MTBF
b. The instantaneous failure rate
c. The probability of survival to time t
d. The measure of safety for a given time period
greater than zero
a. 95%
b. 87%
c. 69%
d. 63%
A population of repairable components (having
an exponential distribution of life) has a MTBF
of 100 hours. What fraction of the components
would fail if the population is operated in a 300
hour mission? (Failed components are not
replaced)
a.
Page
4.40. The probability function of the binomial
distribution is:
b.
C.
4
d.
(1-P) p"
(2)₁¹-P P²
P(x) = (x)(1-P)** p*
(x)(1-P)* p*
P(x) =
P(x) =
P(x) =
Expert Solution
This question has been solved!
Explore an expertly crafted, step-by-step solution for a thorough understanding of key concepts.

This is a popular solution!

Trending now
This is a popular solution!

Step by step
Solved in 2 steps

Recommended textbooks for you
MATLAB: An Introduction with Applications
Statistics
ISBN:
9781119256830
Author:
Amos Gilat
Publisher:
John Wiley & Sons Inc

Probability and Statistics for Engineering and th…
Statistics
ISBN:
9781305251809
Author:
Jay L. Devore
Publisher:
Cengage Learning

Statistics for The Behavioral Sciences (MindTap C…
Statistics
ISBN:
9781305504912
Author:
Frederick J Gravetter, Larry B. Wallnau
Publisher:
Cengage Learning
MATLAB: An Introduction with Applications
Statistics
ISBN:
9781119256830
Author:
Amos Gilat
Publisher:
John Wiley & Sons Inc
Probability and Statistics for Engineering and th…
Statistics
ISBN:
9781305251809
Author:
Jay L. Devore
Publisher:
Cengage Learning
Statistics for The Behavioral Sciences (MindTap C…
Statistics
ISBN:
9781305504912
Author:
Frederick J Gravetter, Larry B. Wallnau
Publisher:
Cengage Learning

Elementary Statistics: Picturing the World (7th E…
Statistics
ISBN:
9780134683416
Author:
Ron Larson, Betsy Farber
Publisher:
PEARSON

The Basic Practice of Statistics
Statistics
ISBN:
9781319042578
Author:
David S. Moore, William I. Notz, Michael A. Fligner
Publisher:
W. H. Freeman

Introduction to the Practice of Statistics
Statistics
ISBN:
9781319013387
Author:
David S. Moore, George P. McCabe, Bruce A. Craig
Publisher:
W. H. Freeman