4.4 6.6 9.7 10.6 10.8 10.9 0.19 0.15 0.57 0.70 0.67 0.63 11.8 12.1 14.3 14.7 15.0 17.3 0.47 0.70 0.60 0.78 0.81 0.78 19.2 23.1 27.4 27.7 31.8 39.5 0.69 1.30 1.05 1.06 1.74 1.62 a. Draw a scatter diagram of the data. Does a simple linear regression model seem appropriate here? b. Fit the simple linear regression model using the method of least squares. Find an estimate of c. Estimate the mean chloride concentration for a watershed that has 1% roadway area.
4.4 6.6 9.7 10.6 10.8 10.9 0.19 0.15 0.57 0.70 0.67 0.63 11.8 12.1 14.3 14.7 15.0 17.3 0.47 0.70 0.60 0.78 0.81 0.78 19.2 23.1 27.4 27.7 31.8 39.5 0.69 1.30 1.05 1.06 1.74 1.62 a. Draw a scatter diagram of the data. Does a simple linear regression model seem appropriate here? b. Fit the simple linear regression model using the method of least squares. Find an estimate of c. Estimate the mean chloride concentration for a watershed that has 1% roadway area.

MATLAB: An Introduction with Applications
6th Edition
ISBN:9781119256830
Author:Amos Gilat
Publisher:Amos Gilat
Chapter1: Starting With Matlab
Section: Chapter Questions
Problem 1P

Related questions
Question
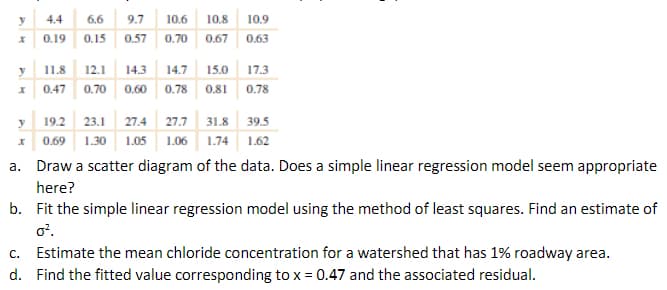
An article in the Journal of Environmental Engineering (1989, Vol. 115(3), pp.
608–619) reported the results of a study on the occurrence of sodium and chloride in surface
streams in central Rhode Island. The following data are chloride concentration y (in milligrams per
liter) and roadway area in the watershed x (in percentage).
Transcribed Image Text:y
4.4
6.6
9.7
10.6
10.8
10.9
0.19
0.15
0.57
0.70
0.67
0.63
y
11.8
12.1
14.3
14.7
15.0
17.3
0.47
0.70
0.60
0.78 0.81
0.78
19.2
23.1
27.4
27.7
31.8
39.5
0.69 1.30 1.05 1.06 1.74 1.62
a. Draw a scatter diagram of the data. Does a simple linear regression model seem appropriate
here?
b. Fit the simple linear regression model using the method of least squares. Find an estimate of
o?.
c. Estimate the mean chloride concentration for a watershed that has 1% roadway area.
d. Find the fitted value corresponding to x = 0.47 and the associated residual.
Expert Solution
This question has been solved!
Explore an expertly crafted, step-by-step solution for a thorough understanding of key concepts.

This is a popular solution!

Trending now
This is a popular solution!

Step by step
Solved in 3 steps with 4 images

Recommended textbooks for you
MATLAB: An Introduction with Applications
Statistics
ISBN:
9781119256830
Author:
Amos Gilat
Publisher:
John Wiley & Sons Inc

Probability and Statistics for Engineering and th…
Statistics
ISBN:
9781305251809
Author:
Jay L. Devore
Publisher:
Cengage Learning

Statistics for The Behavioral Sciences (MindTap C…
Statistics
ISBN:
9781305504912
Author:
Frederick J Gravetter, Larry B. Wallnau
Publisher:
Cengage Learning
MATLAB: An Introduction with Applications
Statistics
ISBN:
9781119256830
Author:
Amos Gilat
Publisher:
John Wiley & Sons Inc
Probability and Statistics for Engineering and th…
Statistics
ISBN:
9781305251809
Author:
Jay L. Devore
Publisher:
Cengage Learning
Statistics for The Behavioral Sciences (MindTap C…
Statistics
ISBN:
9781305504912
Author:
Frederick J Gravetter, Larry B. Wallnau
Publisher:
Cengage Learning

Elementary Statistics: Picturing the World (7th E…
Statistics
ISBN:
9780134683416
Author:
Ron Larson, Betsy Farber
Publisher:
PEARSON

The Basic Practice of Statistics
Statistics
ISBN:
9781319042578
Author:
David S. Moore, William I. Notz, Michael A. Fligner
Publisher:
W. H. Freeman

Introduction to the Practice of Statistics
Statistics
ISBN:
9781319013387
Author:
David S. Moore, George P. McCabe, Bruce A. Craig
Publisher:
W. H. Freeman