1) Estimate the process standard deviation o, using R.

Glencoe Algebra 1, Student Edition, 9780079039897, 0079039898, 2018
18th Edition
ISBN:9780079039897
Author:Carter
Publisher:Carter
Chapter10: Statistics
Section10.4: Distributions Of Data
Problem 19PFA

Related questions
Question
4,,
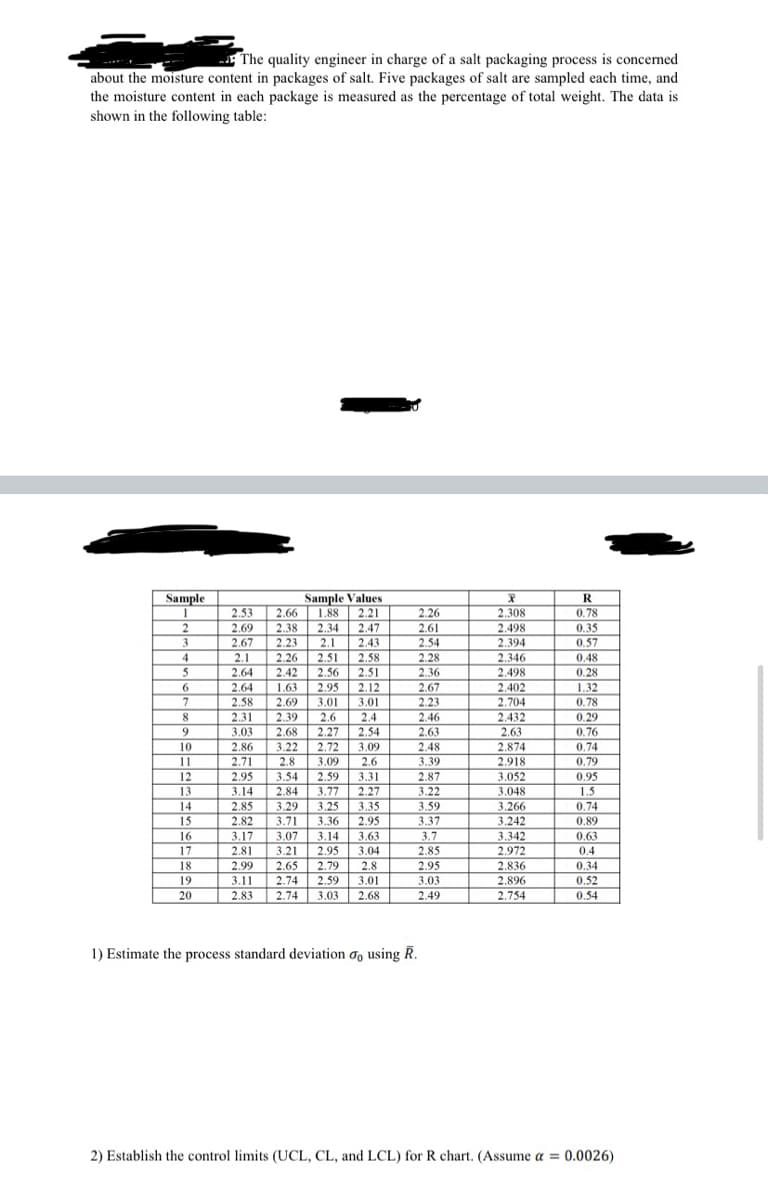
Transcribed Image Text:- The quality engineer in charge of a salt packaging process is concerned
about the moisture content in packages of salt. Five packages of salt are sampled each time, and
the moisture content in each package is measured as the percentage of total weight. The data is
shown in the following table:
Sample
Sample Values
R
2.26
0,78
2.53
2.69
2.66
1,88
2.21
2.308
2.498
0,35
0.57
2
2.38
2.34
2.47
2.61
3
2.67
2.23
2.1
2.43
2.54
2.394
4
2.1
2.26
2.51
2.58
2.28
2.346
0.48
5
2.64
2.42
2.56
2.51
2.36
2.498
0,28
2.67
2.23
2.46
6
1.32
2.64
2.58
2.31
1.63
2.95
2.12
2.402
2.69
2.39
2.68
3.22
3.01
2.4
2.54
2.704
2,432
3.01
0.78
8
2.6
2.27
2,72
0,29
3.03
2.63
2.63
2,874
9
0.76
0.74
0.79
10
2.86
3.09
2.48
11
2.71
2.95
2.8
3.09
2.6
3.39
2.918
3.31
2.27
3.35
12
3.54
2.59
2.87
3.052
0.95
13
3.14
2.84
3.77
3.22
3.048
1.5
2.85
2.82
3.25
3.36
14
3.29
3.59
3.266
0.74
3.242
3,342
15
3.71
3.07
3.21
2.95
3.37
3.7
0.89
16
3.17
3.14
3.63
0.63
17
2.81
2.95
3.04
2.85
2.972
0.4
18
2.99
2.65
2.79
2.8
2.95
2.836
0,34
19
3.11
2.74
2.59
3.01
3.03
2.896
0.52
20
2,83
2.74
3.03
2.68
2.49
2.754
0.54
1) Estimate the process standard deviation o, using R.
2) Establish the control limits (UCL, CL, and LCL) for R chart. (Assume a = 0.0026)
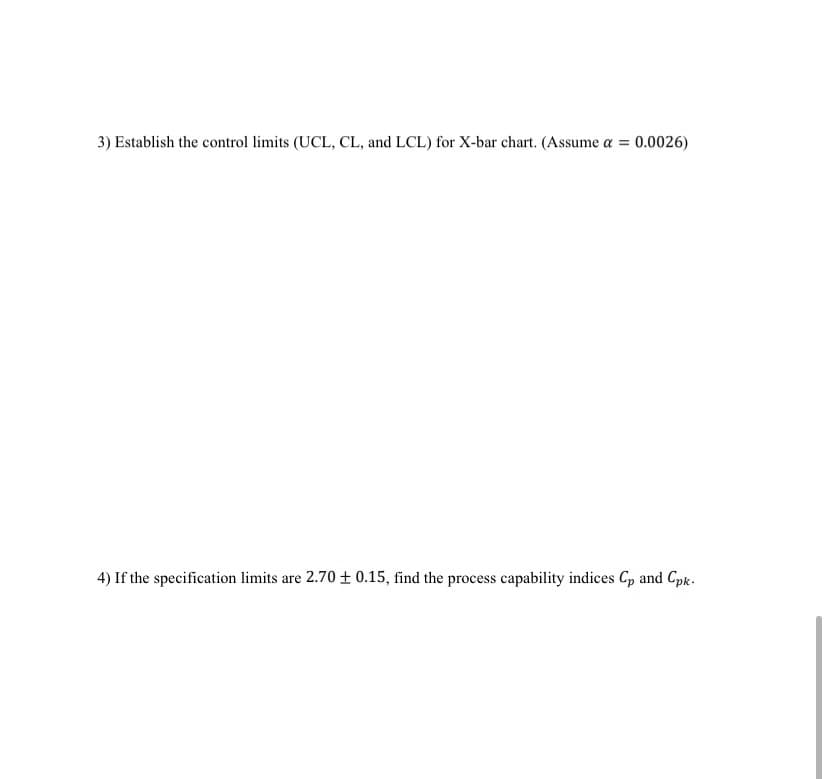
Transcribed Image Text:3) Establish the control limits (UCL, CL, and LCL) for X-bar chart. (Assume a = 0.0026)
4) If the specification limits are 2.70 0.15, find the process capability indices Cp and Cpk.
Expert Solution
This question has been solved!
Explore an expertly crafted, step-by-step solution for a thorough understanding of key concepts.

This is a popular solution!

Trending now
This is a popular solution!

Step by step
Solved in 3 steps

Recommended textbooks for you
Glencoe Algebra 1, Student Edition, 9780079039897…
Algebra
ISBN:
9780079039897
Author:
Carter
Publisher:
McGraw Hill
Glencoe Algebra 1, Student Edition, 9780079039897…
Algebra
ISBN:
9780079039897
Author:
Carter
Publisher:
McGraw Hill