1) Write a one-sentence interpretation of this plot. Also, comment on whether it is appropriate to use the t-distribution for inference based on this interpretation and the conditions necessary. 2) Based on the p-value from the output produced, state the decision you would make in this hypothesis test. Provide a reason for this decision in one sentence. Difference Sample Diff. Std. Err. DF T-Stat P-value μ1 - μ2 -1635.5833 3770.1822 21.894852 -0.43382077 0.6687 3) State your conclusion in the context of this hypothesis test. Write your answer in context in one or two sentences.
1) Write a one-sentence interpretation of this plot. Also, comment on whether it is appropriate to use the t-distribution for inference based on this interpretation and the conditions necessary. 2) Based on the p-value from the output produced, state the decision you would make in this hypothesis test. Provide a reason for this decision in one sentence. Difference Sample Diff. Std. Err. DF T-Stat P-value μ1 - μ2 -1635.5833 3770.1822 21.894852 -0.43382077 0.6687 3) State your conclusion in the context of this hypothesis test. Write your answer in context in one or two sentences.

Algebra & Trigonometry with Analytic Geometry
13th Edition
ISBN:9781133382119
Author:Swokowski
Publisher:Swokowski
Chapter1: Fundamental Concepts Of Algebra
Section1.4: Fractional Expressions
Problem 7E

Related questions
Question
1) Write a one-sentence interpretation of this plot. Also, comment on whether it is appropriate to use the t-distribution for inference based on this interpretation and the conditions necessary.
2) Based on the p-value from the output produced, state the decision you would make in this hypothesis test. Provide a reason for this decision in one sentence.
|
Difference |
Sample Diff. |
Std. Err. |
DF |
T-Stat |
P-value |
|
μ1 - μ2 |
-1635.5833 |
3770.1822 |
21.894852 |
-0.43382077 |
0.6687 |
3) State your conclusion in the context of this hypothesis test. Write your answer in context in one or two sentences.
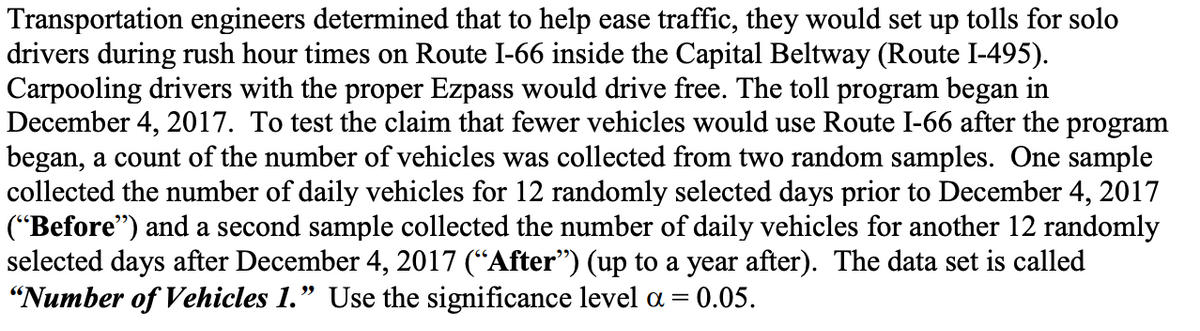
Transcribed Image Text:Transportation engineers determined that to help ease traffic, they would set up tolls for solo
drivers during rush hour times on Route I-66 inside the Capital Beltway (Route I-495).
Carpooling drivers with the proper Ezpass would drive free. The toll program began in
December 4, 2017. To test the claim that fewer vehicles would use Route I-66 after the program
began, a count of the number of vehicles was collected from two random samples. One sample
collected the number of daily vehicles for 12 randomly selected days prior to December 4, 2017
("Before") and a second sample collected the number of daily vehicles for another 12 randomly
selected days after December 4, 2017 (“After") (up to a year after). The data set is called
"Number of Vehicles 1." Use the significance level a =
= 0.05.
Transcribed Image Text:After- •
Before-
of
5000
10000
15000
20000
25000
30000
35000
Expert Solution
This question has been solved!
Explore an expertly crafted, step-by-step solution for a thorough understanding of key concepts.

This is a popular solution!

Trending now
This is a popular solution!

Step by step
Solved in 2 steps

Recommended textbooks for you
Algebra & Trigonometry with Analytic Geometry
Algebra
ISBN:
9781133382119
Author:
Swokowski
Publisher:
Cengage

Algebra: Structure And Method, Book 1
Algebra
ISBN:
9780395977224
Author:
Richard G. Brown, Mary P. Dolciani, Robert H. Sorgenfrey, William L. Cole
Publisher:
McDougal Littell

Mathematics For Machine Technology
Advanced Math
ISBN:
9781337798310
Author:
Peterson, John.
Publisher:
Cengage Learning,
Algebra & Trigonometry with Analytic Geometry
Algebra
ISBN:
9781133382119
Author:
Swokowski
Publisher:
Cengage
Algebra: Structure And Method, Book 1
Algebra
ISBN:
9780395977224
Author:
Richard G. Brown, Mary P. Dolciani, Robert H. Sorgenfrey, William L. Cole
Publisher:
McDougal Littell
Mathematics For Machine Technology
Advanced Math
ISBN:
9781337798310
Author:
Peterson, John.
Publisher:
Cengage Learning,

College Algebra (MindTap Course List)
Algebra
ISBN:
9781305652231
Author:
R. David Gustafson, Jeff Hughes
Publisher:
Cengage Learning