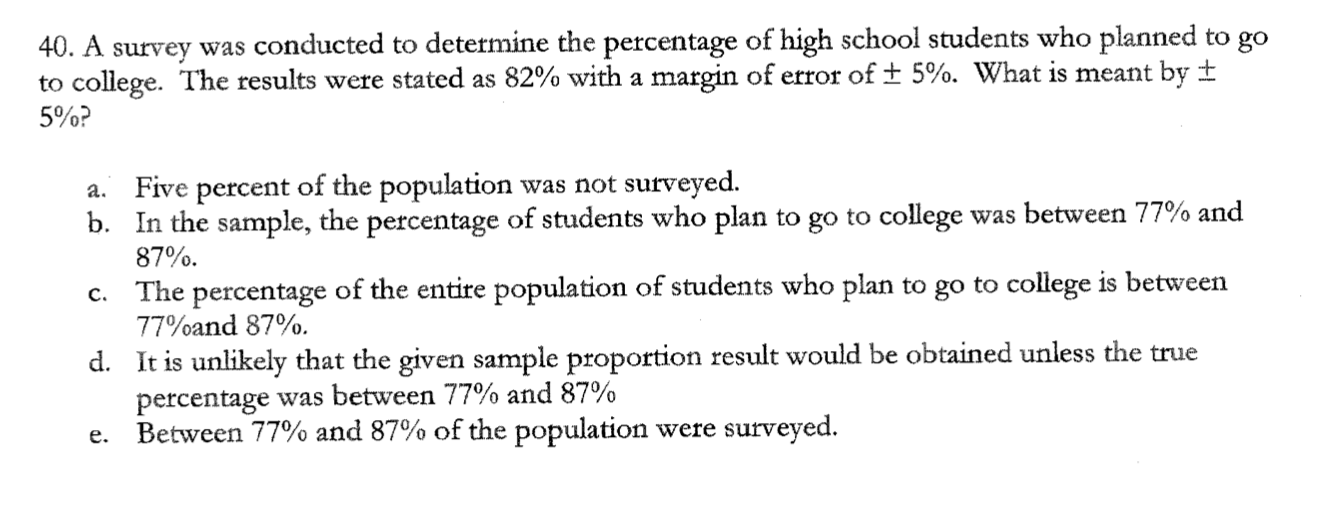
40. A survey was conducted to determine the percentage of high school students who planned to go to college. The results were stated as 82% with a margin of error of ± 5%. What is meant by ± 5%? a. Five percent of the population was not surveyed. b. In the sample, the percentage of students who plan to go to college was between 77% and 87%. c. The percentage of the entire population of students who plan to go to college is between 77%and 87%. d. It is unlikely that the given sample proportion result would be obtained unless the true percentage was between 77% and 87% e. Between 77% and 87% of the population were surveyed.
40. A survey was conducted to determine the percentage of high school students who planned to go to college. The results were stated as 82% with a margin of error of ± 5%. What is meant by ± 5%? a. Five percent of the population was not surveyed. b. In the sample, the percentage of students who plan to go to college was between 77% and 87%. c. The percentage of the entire population of students who plan to go to college is between 77%and 87%. d. It is unlikely that the given sample proportion result would be obtained unless the true percentage was between 77% and 87% e. Between 77% and 87% of the population were surveyed.

MATLAB: An Introduction with Applications
6th Edition
ISBN:9781119256830
Author:Amos Gilat
Publisher:Amos Gilat
Chapter1: Starting With Matlab
Section: Chapter Questions
Problem 1P

Related questions

Question
Transcribed Image Text:40. A survey was conducted to determine the percentage of high school students who planned to go
to college. The results were stated as 82% with a margin of error of ± 5%. What is meant by ±
5%?
a. Five percent of the population was not surveyed.
b. In the sample, the percentage of students who plan to go to college was between 77% and
87%.
c. The percentage of the entire population of students who plan to go to college is between
77%and 87%.
d. It is unlikely that the given sample proportion result would be obtained unless the true
percentage was between 77% and 87%
e. Between 77% and 87% of the population were surveyed.
Expert Solution
This question has been solved!
Explore an expertly crafted, step-by-step solution for a thorough understanding of key concepts.

This is a popular solution!

Trending now
This is a popular solution!

Step by step
Solved in 2 steps with 1 images

Knowledge Booster


Learn more about
Need a deep-dive on the concept behind this application? Look no further. Learn more about this topic, statistics and related others by exploring similar questions and additional content below.Recommended textbooks for you
MATLAB: An Introduction with Applications
Statistics
ISBN:
9781119256830
Author:
Amos Gilat
Publisher:
John Wiley & Sons Inc

Probability and Statistics for Engineering and th…
Statistics
ISBN:
9781305251809
Author:
Jay L. Devore
Publisher:
Cengage Learning

Statistics for The Behavioral Sciences (MindTap C…
Statistics
ISBN:
9781305504912
Author:
Frederick J Gravetter, Larry B. Wallnau
Publisher:
Cengage Learning
MATLAB: An Introduction with Applications
Statistics
ISBN:
9781119256830
Author:
Amos Gilat
Publisher:
John Wiley & Sons Inc
Probability and Statistics for Engineering and th…
Statistics
ISBN:
9781305251809
Author:
Jay L. Devore
Publisher:
Cengage Learning
Statistics for The Behavioral Sciences (MindTap C…
Statistics
ISBN:
9781305504912
Author:
Frederick J Gravetter, Larry B. Wallnau
Publisher:
Cengage Learning

Elementary Statistics: Picturing the World (7th E…
Statistics
ISBN:
9780134683416
Author:
Ron Larson, Betsy Farber
Publisher:
PEARSON

The Basic Practice of Statistics
Statistics
ISBN:
9781319042578
Author:
David S. Moore, William I. Notz, Michael A. Fligner
Publisher:
W. H. Freeman

Introduction to the Practice of Statistics
Statistics
ISBN:
9781319013387
Author:
David S. Moore, George P. McCabe, Bruce A. Craig
Publisher:
W. H. Freeman