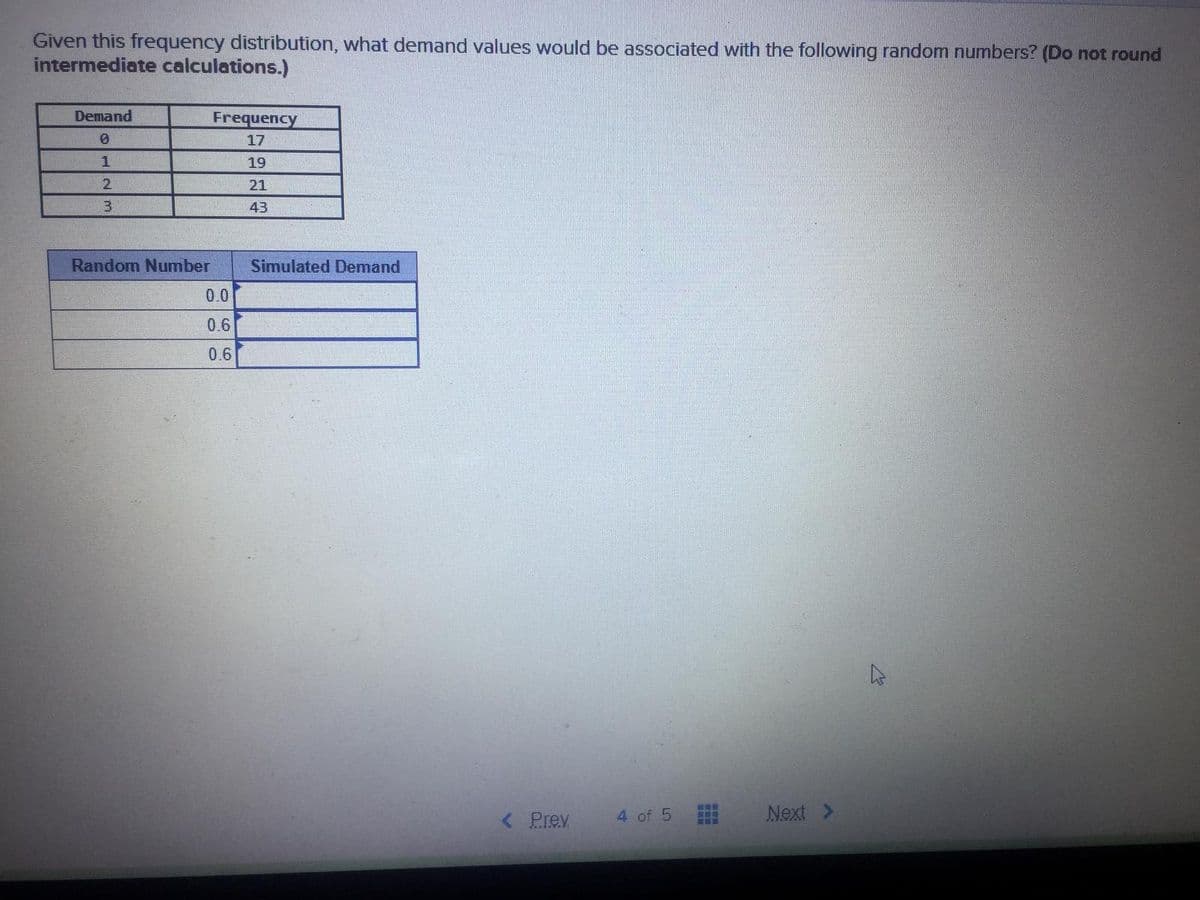
43 Random Number Simulated Demand 0.0 0.6 0.6


Q: (a) Calculate the cost of saving (2 decimal number) if she planned to use optimum lot size in her…
A: Given, Weekly demand = 10 units Annual demand D = 10*36 = 360 units ( since 36 weeks per year )…
Q: The ERG Theory was developed by which of the following theorists? a. Clay Alderfer b. Frederick…
A: The management theories are the collection of ideas that gives recommendations of general rules for…
Q: HW1 Q1 Consider the emergency department of a hospital that operates as follows: Upon arrival,…
A: An average is the "typical" number of a gathering of numbers made by blending the gathering of…
Q: Your deceased client had a gross estate valued at $14 million. His estate includes approximately…
A: Solution: B The use of the alternative valuation date for estate assets .
Q: Question 1 Collection of methods for planning experiments, obtaining data, and then organizing,…
A: Data collection is the act of acquiring and quantifying information on variables of interest in a…
Q: 1. Power Notebooks, Inc. plans to manufacture a new line of notebook computers. Management is trying…
A: We’ll answer the first question since the exact one wasn’t specified. Please submit a new question…
Q: 2021FA-BUS-2220-DL01 Business Law I (... Description: Catherine Romanov was a loan officer who…
A: Although it's wrong to be defaulted in the bank. Some borrower intentionally defaulted in the bank…
Q: Which of the two machines, if any, do you recommend by using: 1. Repeatability assumption 2.…
A: On the basis of useful life, one cycle of machine A and 2 cycle of machine B canbe obtained through…
Q: STARS Which products or services grow the fastest and have the highestmargins in corporate…
A: Boston Consulting Group matrix is a four celled matrix (2*2) used as the most renowned portfolio…
Q: Cost Estimation; High-Low Method; MAPE Ethan Manufacturing Inc. produces floor matsfor automobiles.…
A: a.
Q: Comment on the present system of Heartha Hardware and Construction Supplies. Using process…
A: Introduction: The term Market refers to an exchange of goods and services between the buyer and the…
Q: account receivable departments is not occurring in the manner originally requested. Further, the…
A: By establishing the source of the problem, its location, the time it happens, who is impacted, and…
Q: snip
A: As for a customer, the incoming product is the final output which they buy from the seller.…
Q: Which of the following statement is relevant to services? a. Services can be measured b. Services…
A: Services are intangible cannot be touched, stored and perished.
Q: Question 2 Mr. Ferdinand is a well known entrepreneur who sells fresh organic beef to persons in the…
A: A Small Introduction about Forecast Forecasting is a procedure that involves authentic information…
Q: Question 14 Which function is mostly housed within the headquarters of a multinational company R&D…
A: A multinational company has its offices in different locations in different countries and have a…
Q: SCOR Model
A: SCOR is a management technique under the preview of Supply Chain Management ( SCM ). It stands for…
Q: Demand Frequency 23 1 16 2 18 3 43 Random Number Simulated Demand 0.1 0.6 0.4
A: THE ANSWER IS AS BELOW:
Q: Construct AON and AOA diagram.
A: THE ANSWER IS AS BELOW:
Q: Eimi want to create a survey for her research , however Eimi printed the survey questionnaire and…
A: Since you have asked multiple questions, we will solve the first question for you. If you want any…
Q: Organizing involves determining organizational goald and means for achieving them Question 2…
A: Organizing : Organizing is an important function of management which brings together the capital…
Q: Question 40 A company buys medium grade carpet in 100-foot rolls. The average number of defects per…
A: Given data: The average number of defectts per roll ( λ ) = 1.8 The formula for the Poisson…
Q: 11.2 Determine an upper bound for each of the following aircraft subsystem MTTRS if a system…
A: MTTR starts the second a disappointment is distinguished and incorporates demonstrative time, fix…
Q: Debbie owns 100% of the common stock (3,750 shares, valued at $2,517,000) of Great West Linens Inc.…
A: As the name suggests, preferred stock gets preference over the common stock in terms of dividends as…
Q: Example of business strategy where is about profit or value
A: A business strategy would outline the plan of action to achieve the vision and set objectives and…
Q: Question 1 Determine whether the following statements are true or false. Statement T or F 1.…
A: Operations management deals with certain aspects such as planning, controlling, forecasting etc.…
Q: Management of Mittel Rhein AG of Köln, Germany, would like to reduce the amount of time between when…
A: 1. Throughput time= Process time + Inspection Time + Move Time + Queue Time = 2.6 days + 0.5 days +…
Q: what is System safety reviews
A: The system safety is known as the system based approach in which the various concepts are used for…
Q: The cost of maintenance on the entire production plant would be considered a facility-level cost.…
A: True
Q: . Compute the delivery cycle time. (Round your intermediate calculations and final answer to 1…
A:
Q: O b. FALSE
A: Lower Control Limit (LCL): Similar to upper manipulate limit (UCL) however representing a downwards…
Q: Which of the following is NOT a strategy for improving intersecio Oa. Adding turn lanes for…
A: Ans: intersection roadways have been developed in order to connect various vehicles from one path to…
Q: Use the regression output to write the surgical unit cost equation. b. Based on the cost equation,…
A: The form of the regression equation is y=mx+b where y is the dependent variable, b is the…
Q: T F Line positions support staff positions in decisionmaking.
A: These are the different scales of workers who work in different domains of the organization in order…
Q: 分 56uu5爷 价格方格打56 pauanmu 后60后 2 ia 分合合
A: Strategic management can be defined as the management in which a manger of an organization makes its…
Q: John Hospital contains 450 beds. The average occupancy rate is 80% per month. In other words, on…
A: High low method is a way to separate the fixed and variable costs with a limited amount of the data.…
Q: How the automatic guided vehicles provide safe movement of loads. In case the production environment…
A: Safe movement loads PC-controlled and wheel-based, Automatic Guided Vehicles (AGV) are load…
Q: example of constructed balanced scorecard
A: Balance scorecard is a performance measuring & startegic management tool which is used for…
Q: Classify the following risks into variation, foreseen uncertainty, unforeseen uncertainty, and…
A: The answer is Unforeseen uncertainty.
Q: Height, Weight, Length are the example of which scale?
A: Data is a collection of observations which are collected with an objective of analyzing. These data…
Q: Components of an integrated manufacturing system include: Question 17 options: a. material…
A: Integrated manufacturing system involves the whole process of product management from product and…
Q: Appraise the handling of information in mc donals. 2. Identify key factors in matching information…
A: Employee performance is the results of work that has been accomplished by Associate in Nursing…
Q: Which of the following is NOT true about the structure of NHL revenue sharing: Playoff teams share…
A: The National Hockey League is an ice hockey league in North America including 32 teams 25 in the US…
Q: Q5/ A container of 1500 gallon capacity, initially contains 600 gallons of water with 5 lbs of a…
A:
Q: What the steps in controlling cycle and what is controlling function
A: Controlling is a management function in which the manager evaluates the organization's success in…
Q: Which of the following is not an example of automated material handling equipment used in…
A: Automated Material Handling: Automated Material Handling entails the use of robots and other…

Step by step
Solved in 2 steps with 1 images

- Continuing the previous problem, assume, as in Problem 11, that the damage amount is normally distributed with mean 3000 and standard deviation 750. Run @RISK with 5000 iterations to simulate the amount you pay for damage. Compare your results with those in the previous problem. Does it appear to matter whether you assume a triangular distribution or a normal distribution for damage amounts? Why isnt this a totally fair comparison? (Hint: Use @RISKs Define Distributions tool to find the standard deviation for the triangular distribution.)The annual demand for Prizdol, a prescription drug manufactured and marketed by the NuFeel Company, is normally distributed with mean 50,000 and standard deviation 12,000. Assume that demand during each of the next 10 years is an independent random number from this distribution. NuFeel needs to determine how large a Prizdol plant to build to maximize its expected profit over the next 10 years. If the company builds a plant that can produce x units of Prizdol per year, it will cost 16 for each of these x units. NuFeel will produce only the amount demanded each year, and each unit of Prizdol produced will sell for 3.70. Each unit of Prizdol produced incurs a variable production cost of 0.20. It costs 0.40 per year to operate a unit of capacity. a. Among the capacity levels of 30,000, 35,000, 40,000, 45,000, 50,000, 55,000, and 60,000 units per year, which level maximizes expected profit? Use simulation to answer this question. b. Using the capacity from your answer to part a, NuFeel can be 95% certain that actual profit for the 10-year period will be between what two values?Dilberts Department Store is trying to determine how many Hanson T-shirts to order. Currently the shirts are sold for 21, but at later dates the shirts will be offered at a 10% discount, then a 20% discount, then a 40% discount, then a 50% discount, and finally a 60% discount. Demand at the full price of 21 is believed to be normally distributed with mean 1800 and standard deviation 360. Demand at various discounts is assumed to be a multiple of full-price demand. These multiples, for discounts of 10%, 20%, 40%, 50%, and 60% are, respectively, 0.4, 0.7, 1.1, 2, and 50. For example, if full-price demand is 2500, then at a 10% discount customers would be willing to buy 1000 T-shirts. The unit cost of purchasing T-shirts depends on the number of T-shirts ordered, as shown in the file P10_36.xlsx. Use simulation to determine how many T-shirts the company should order. Model the problem so that the company first orders some quantity of T-shirts, then discounts deeper and deeper, as necessary, to sell all of the shirts.
- When you use a RISKSIMTABLE function for a decision variable, such as the order quantity in the Walton model, explain how this provides a fair comparison across the different values tested.Referring to Example 11.1, if the average bid for each competitor stays the same, but their bids exhibit less variability, does Millers optimal bid increase or decrease? To study this question, assume that each competitors bid, expressed as a multiple of Millers cost to complete the project, follows each of the following distributions. a. Triangular with parameters 1.0, 1.3, and 2.4 b. Triangular with parameters 1.2, 1.3, and 2.2 c. Use @RISKs Define Distributions window to check that the distributions in parts a and b have the same mean as the original triangular distribution in the example, but smaller standard deviations. What is the common mean? Why is it not the same as the most likely value, 1.3?The file P13_21.xlsx contains the weekly sales of rakes at a hardware store for a two-year period. Use the moving averages method, with spans of your choice, to forecast sales for the next 30 weeks. Does this method appear to track sales well? If not, what might be the reason?
- Play Things is developing a new Lady Gaga doll. The company has made the following assumptions: The doll will sell for a random number of years from 1 to 10. Each of these 10 possibilities is equally likely. At the beginning of year 1, the potential market for the doll is two million. The potential market grows by an average of 4% per year. The company is 95% sure that the growth in the potential market during any year will be between 2.5% and 5.5%. It uses a normal distribution to model this. The company believes its share of the potential market during year 1 will be at worst 30%, most likely 50%, and at best 60%. It uses a triangular distribution to model this. The variable cost of producing a doll during year 1 has a triangular distribution with parameters 15, 17, and 20. The current selling price is 45. Each year, the variable cost of producing the doll will increase by an amount that is triangularly distributed with parameters 2.5%, 3%, and 3.5%. You can assume that once this change is generated, it will be the same for each year. You can also assume that the company will change its selling price by the same percentage each year. The fixed cost of developing the doll (which is incurred right away, at time 0) has a triangular distribution with parameters 5 million, 7.5 million, and 12 million. Right now there is one competitor in the market. During each year that begins with four or fewer competitors, there is a 25% chance that a new competitor will enter the market. Year t sales (for t 1) are determined as follows. Suppose that at the end of year t 1, n competitors are present (including Play Things). Then during year t, a fraction 0.9 0.1n of the company's loyal customers (last year's purchasers) will buy a doll from Play Things this year, and a fraction 0.2 0.04n of customers currently in the market ho did not purchase a doll last year will purchase a doll from Play Things this year. Adding these two provides the mean sales for this year. Then the actual sales this year is normally distributed with this mean and standard deviation equal to 7.5% of the mean. a. Use @RISK to estimate the expected NPV of this project. b. Use the percentiles in @ RISKs output to find an interval such that you are 95% certain that the companys actual NPV will be within this interval.An automobile manufacturer is considering whether to introduce a new model called the Racer. The profitability of the Racer depends on the following factors: The fixed cost of developing the Racer is triangularly distributed with parameters 3, 4, and 5, all in billions. Year 1 sales are normally distributed with mean 200,000 and standard deviation 50,000. Year 2 sales are normally distributed with mean equal to actual year 1 sales and standard deviation 50,000. Year 3 sales are normally distributed with mean equal to actual year 2 sales and standard deviation 50,000. The selling price in year 1 is 25,000. The year 2 selling price will be 1.05[year 1 price + 50 (% diff1)] where % diff1 is the number of percentage points by which actual year 1 sales differ from expected year 1 sales. The 1.05 factor accounts for inflation. For example, if the year 1 sales figure is 180,000, which is 10 percentage points below the expected year 1 sales, then the year 2 price will be 1.05[25,000 + 50( 10)] = 25,725. Similarly, the year 3 price will be 1.05[year 2 price + 50(% diff2)] where % diff2 is the percentage by which actual year 2 sales differ from expected year 2 sales. The variable cost in year 1 is triangularly distributed with parameters 10,000, 12,000, and 15,000, and it is assumed to increase by 5% each year. Your goal is to estimate the NPV of the new car during its first three years. Assume that the company is able to produce exactly as many cars as it can sell. Also, assume that cash flows are discounted at 10%. Simulate 1000 trials to estimate the mean and standard deviation of the NPV for the first three years of sales. Also, determine an interval such that you are 95% certain that the NPV of the Racer during its first three years of operation will be within this interval.You are considering a 10-year investment project. At present, the expected cash flow each year is 10,000. Suppose, however, that each years cash flow is normally distributed with mean equal to last years actual cash flow and standard deviation 1000. For example, suppose that the actual cash flow in year 1 is 12,000. Then year 2 cash flow is normal with mean 12,000 and standard deviation 1000. Also, at the end of year 1, your best guess is that each later years expected cash flow will be 12,000. a. Estimate the mean and standard deviation of the NPV of this project. Assume that cash flows are discounted at a rate of 10% per year. b. Now assume that the project has an abandonment option. At the end of each year you can abandon the project for the value given in the file P11_60.xlsx. For example, suppose that year 1 cash flow is 4000. Then at the end of year 1, you expect cash flow for each remaining year to be 4000. This has an NPV of less than 62,000, so you should abandon the project and collect 62,000 at the end of year 1. Estimate the mean and standard deviation of the project with the abandonment option. How much would you pay for the abandonment option? (Hint: You can abandon a project at most once. So in year 5, for example, you abandon only if the sum of future expected NPVs is less than the year 5 abandonment value and the project has not yet been abandoned. Also, once you abandon the project, the actual cash flows for future years are zero. So in this case the future cash flows after abandonment should be zero in your model.)
- Assume that all of a companys job applicants must take a test, and that the scores on this test are normally distributed. The selection ratio is the cutoff point used by the company in its hiring process. For example, a selection ratio of 25% means that the company will accept applicants for jobs who rank in the top 25% of all applicants. If the company chooses a selection ratio of 25%, the average test score of those selected will be 1.27 standard deviations above average. Use simulation to verify this fact, proceeding as follows. a. Show that if the company wants to accept only the top 25% of all applicants, it should accept applicants whose test scores are at least 0.674 standard deviation above average. (No simulation is required here. Just use the appropriate Excel normal function.) b. Now generate 1000 test scores from a normal distribution with mean 0 and standard deviation 1. The average test score of those selected is the average of the scores that are at least 0.674. To determine this, use Excels DAVERAGE function. To do so, put the heading Score in cell A3, generate the 1000 test scores in the range A4:A1003, and name the range A3:A1003 Data. In cells C3 and C4, enter the labels Score and 0.674. (The range C3:C4 is called the criterion range.) Then calculate the average of all applicants who will be hired by entering the formula =DAVERAGE(Data, "Score", C3:C4) in any cell. This average should be close to the theoretical average, 1.27. This formula works as follows. Excel finds all observations in the Data range that satisfy the criterion described in the range C3:C4 (Score0.674). Then it averages the values in the Score column (the second argument of DAVERAGE) corresponding to these entries. See online help for more about Excels database D functions. c. What information would the company need to determine an optimal selection ratio? How could it determine the optimal selection ratio?A new edition of a very popular textbook will be published a year from now. The publisher currently has 1000 copies on hand and is deciding whether to do another printing before the new edition comes out. The publisher estimates that demand for the book during the next year is governed by the probability distribution in the file P10_31.xlsx. A production run incurs a fixed cost of 15,000 plus a variable cost of 20 per book printed. Books are sold for 190 per book. Any demand that cannot be met incurs a penalty cost of 30 per book, due to loss of goodwill. Up to 1000 of any leftover books can be sold to Barnes and Noble for 45 per book. The publisher is interested in maximizing expected profit. The following print-run sizes are under consideration: 0 (no production run) to 16,000 in increments of 2000. What decision would you recommend? Use simulation with 1000 replications. For your optimal decision, the publisher can be 90% certain that the actual profit associated with remaining sales of the current edition will be between what two values?The DC Cisco office is trying to predict the revenue it will generate next week. Ten deals may close next week. The probability of each deal closing and data on the possible size of each deal (in millions of dollars) are listed in the file P11_55.xlsx. Use simulation to estimate total revenue. Based on the simulation, the company can be 95% certain that its total revenue will be between what two numbers?