43. What was the exposure in the study? A. Age of mother at conception B. Having Down syndrome C. Infant age D. Severity of condition 44. What was the outcome in the study? A. Age of mother at conception B. Having Down syndrome C. Infant age D. Severity of condition 45. Based on the finding, what age bracket is recommended for women to bear children with low risk of having Down syndrome? A. 34 and 35 B. 34 and below C. 35 and above D. 35 only
43. What was the exposure in the study? A. Age of mother at conception B. Having Down syndrome C. Infant age D. Severity of condition 44. What was the outcome in the study? A. Age of mother at conception B. Having Down syndrome C. Infant age D. Severity of condition 45. Based on the finding, what age bracket is recommended for women to bear children with low risk of having Down syndrome? A. 34 and 35 B. 34 and below C. 35 and above D. 35 only

Big Ideas Math A Bridge To Success Algebra 1: Student Edition 2015
1st Edition
ISBN:9781680331141
Author:HOUGHTON MIFFLIN HARCOURT
Publisher:HOUGHTON MIFFLIN HARCOURT
Chapter11: Data Analysis And Displays
Section: Chapter Questions
Problem 10CT

Related questions
Question
43. What was the exposure in the study?
A. Age of mother at conception
B. Having Down syndrome
C. Infant age
D. Severity of condition
44. What was the outcome in the study?
A. Age of mother at conception
B. Having Down syndrome
C. Infant age
D. Severity of condition
45. Based on the finding, what age bracket is recommended for women to bear children with low risk
of having Down syndrome?
A. 34 and 35
B. 34 and below
C. 35 and above
D. 35 only
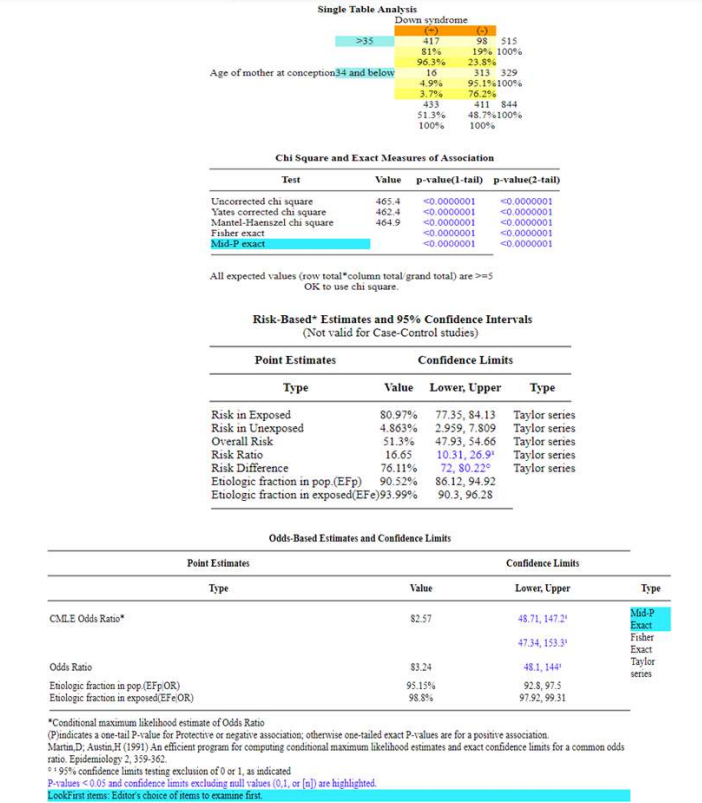
Transcribed Image Text:Single Table Analysis
Down syndrome
>35
417
81%
98 515
19% 100%
23.8%
313 329
95.1%100%
96.3%
16
Age of mother at conception34 and below
4.9%
3.7%
433
51.3%
100%
76.2%
411 844
48.7%100%
100%
Chi Square and Exact Measures of Association
Test
Value p-value(1-tail) p-value(2-tail)
Uncorrected chi square
Yates corrected chỉ square
Mantel-Haenszel chi square
Fisher exact
Mid-P exact
c0.0000001
<0.0000001
465.4
<0.0000001
<0.0000001
462.4
464.9
<0.0000001
<0.0000001
<0.0000001
<0.0000001
<0.0000001
<0.0000001
All expected values (row total"column total grand total) are >=s
OK to use chi square.
Risk-Based* Estimates and 95% Confidence Intervals
(Not valid for Case-Control studies)
Point Estimates
Confidence Limits
Туре
Value Lower, Upper
Туре
Risk in Exposed
Risk in Unexposed
Overall Risk
Risk Ratio
Risk Difference
Etiologic fraction in pop.(EFp) 90.52% 86.12, 94.92
Etiologic fraction in exposed(EFe)93.99%
80.97% 77.35, 84.13 Taylor series
2.959, 7.809 Taylor series
47.93, 54.66 Taylor series
Taylor series
Taylor series
4.863%
51.3%
16.65
76.11%
10.31, 26.9"
72, 80.22°
90.3, 96.28
Odds-Based Estimates and Confidence Limits
Point Estimates
Confidence Limits
Type
Value
Lower, Upper
Type
Mid-P
Exact
Fisher
Exact
Taylor
CMLE Odds Ratio"
82.57
48.71, 147.2
47.34, 153.3
Odds Ratio
83.24
48.1, 144
series
fraction in pop (EFpOR)
Eiologic fraction in exposed(EFe OR)
95.15%
92.8, 97.5
97.92, 99.31
98.8%
*Conditional maximum likelihood estimate of Odds Ratio
(Pjindicates a one-tail P-value for Protective or negative association; otherwise one-tailed exact P-values are for a positive association.
Martin D. Austin, H (1991) An efficient program for computing conditional maximum likelihood estimates and exact confidence limits for a common odds
ratio. Epidemiology 2, 359-362.
** 95% confidence limits testing exclusion of 0 or 1, as indicated
P-values <0.05 and confidence limits excluding null values (0,1, or (a) are highlighted.
LookFirst items: Editor's choice of items to examine first.
Expert Solution
This question has been solved!
Explore an expertly crafted, step-by-step solution for a thorough understanding of key concepts.

Step by step
Solved in 2 steps

Recommended textbooks for you
Big Ideas Math A Bridge To Success Algebra 1: Stu…
Algebra
ISBN:
9781680331141
Author:
HOUGHTON MIFFLIN HARCOURT
Publisher:
Houghton Mifflin Harcourt

Glencoe Algebra 1, Student Edition, 9780079039897…
Algebra
ISBN:
9780079039897
Author:
Carter
Publisher:
McGraw Hill
Big Ideas Math A Bridge To Success Algebra 1: Stu…
Algebra
ISBN:
9781680331141
Author:
HOUGHTON MIFFLIN HARCOURT
Publisher:
Houghton Mifflin Harcourt
Glencoe Algebra 1, Student Edition, 9780079039897…
Algebra
ISBN:
9780079039897
Author:
Carter
Publisher:
McGraw Hill