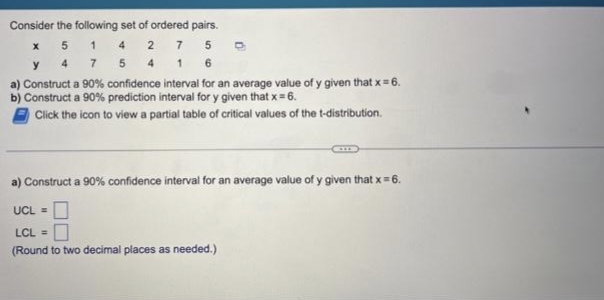
5 1 4 2 47 5 4 16 750 nstruct a 90% confidence interval for an average value of y given that x = 6. instruct a 90% prediction interval for y given that x = 6. Click the icon to view a partial table of critical values of the t-distribution. nstruct a 90% confidence interval for an average value of y given that x = 6.


Q: An elementary school claims that the standard deviation in reading scores of its fourth grade…
A: given data,an elementary school claims that the standard deviation in reading scores of its fourth…
Q: Determine whether the given correlation coefficient is statistically significant at the specified…
A: Given that r=−0.561, α=0.05, n=25
Q: The following table lists body temperatures of seven subjects at 8 AM and at 12 AM. The data are…
A: Non parametric test are used when the population fails to follow normal distribution. Sign test and…
Q: Several students were tested for reaction times (in thousandths of a second) using their right and…
A: The data shows the reaction times using their right and left hands.
Q: eights of players on a high school football team. a. What is the interquartile range of the weights…
A: Box plot provide 5 number summary i.e min,Q1,Q2,Q3,max
Q: 1. Spinner A is spun and then Spinner B is spun. Show two ways to represent the sample space for…
A: Spinner A has two possible options: Red and Blue. Spinner B has six possible options: D, B, S, M,…
Q: A researcher wishes to estimate, with 99% confidence, the population proportion of adults who…
A: given data, CI=0.99α=1-0.99=0.01E=4%=0.04Zc:=Zα/2=Z0.01/2=Z0.0050=2.576 [from excel function, code…
Q: Which model would you select? Explain your choice and the criteria used to reach your decision.
A: Given that, Dependent variable (y) = mileage Independent variables: x1 = engine type x2= number of…
Q: Systolic blood pressure levels above 120 mm Hg are considered to be high. For the 100 systolic blood…
A: given data,n=100x¯=121.88s=16.16536claim :μ>120α=0.10
Q: Step 3: Find the p-value of the test statistic. P(FEV p-value= A = 8A= 28 => 88==
A: The data shows the weights of the bottles at the two plants.
Q: only has solutions for a, b, and c. Where is the solutions for d, e, and f?
A: Meantime =2.7 standard deviation=1.9 two jobs per 8 hours a day=arrival rate λ = 28=0.25μ = 2.7σ =…
Q: Construct F2,3, i.e., a F distributed random variable with (2, 3) degrees of freedom Construct…
A:
Q: Below are the jersey numbers of 11 players randomly selected from a football team. Find the range,…
A: From the provided information, Sample size (n) = 11 The data values are as follow: 2, 41, 73, 7, 60,…
Q: This is what it means to be "95% confident" when we create a 95% confidence interval for the…
A: To find: This is what it means to be "95% confident" when we create a 95% confidence interval for…
Q: b. The test statistic t OB c. The p-value = = (please show your answer to 3 decimal places.) (Please…
A: The data shows the number of volunteer hours for fraternity brothers and sorority sisters.
Q: ndard deviation 0.4 minutes. What percent of athletes complete the course in more than 9 minutes?…
A: Given that. X~N( μ , ?) μ=8.25 , ?=0.4 Z-score =( x - μ )/?
Q: x Let ŷ represent the profit (in thousands of dollars) for a certain company years after 1965. A…
A: Given Y^=2.42X+15 X=1978
Q: b. The test statistic 0° c. The p-value = d. The p-value is ≤ ✓ O α (please show your answer to 3…
A: Given that Sample size n1=59 , n2=57 Sample means x1=138 , x2=113 Standard deviation s1=42 , s2=50
Q: You are interested in the relationship between gender and violent victimization. You have the data…
A: Lambda is also a measure of association. It explain the proportion of reduction in error used to…
Q: Use the technology display, which results from the head injury measurements from car crash dummies…
A: From the given information, test the null hypothesis is that head injury measurements are not…
Q: Suppose you are a dolphin trainer at SeaWorld. You teach the dolphins by rewarding them with fish…
A: See the solution attached.
Q: 20. A set of n = 15 pairs of scores (X and Y values) pro- duces a regression equation of Y = 3X + 8.…
A: Linear regression model consist of one dependent and one independent variable.
Q: A researcher wants to study differences in opinion on environmenta issues among different…
A: It is given that the statement about the sampling method. Here, need to find out the correct choice…
Q: Do left handed starting pitchers pitch more innings per game on average than right handed starting…
A: As per the Bartleby guildlines we have to solve first three subparts and rest can be reposted....…
Q: The amount of sodium (in milligrams) in one serving for a random sample of three different kinds of…
A: In the given situation, There are 3 groups. Condiments group has 7 values. Cereals group has 7…
Q: Find the (a) mean, (b) median, (c) mode, and (d) midrange for the data and then (e) answer the given…
A: Note: As per the Bartelby guidelines only three sub-parts can be answered. Kindly resubmit the…
Q: Consider the following hypothesis test. Ho: μ ≥ 20 H₂: μ< 20 A sample of 50 provided a sample mean…
A: Solution: Given information: n= 50 Sample size x =19.4 Sample mean σ=2 Population standard…
Q: general, how is the magnitude of the standard error of estimate related to the value of the…
A: Correlation coefficient measure the degree of linear relationship between two variables
Q: Refer to the accompanying table, which describes the number of adults in groups of five who…
A: Data given X P(X=x) 0 0.176 1 0.366 2 0.301 3 0.119 4 0.033 5 0.005
Q: is a computer-consulting firm. The number of new clients that it has obtained each month has ranged…
A: here no. of new clients and their probability is given we have to find out the variance for the…
Q: A chain of taco restaurants claims that the population mean of the wait times in their drive-thru…
A: Given that a) x = 5.39 , n = 40 , σ = 2.7999% CI = α= 1-0.99 = 0.01 Zc = Z0.01/2 = 2.576 ( given)…
Q: What measures the proportion (or percentage) of the observed variation in the Y-variable that can be…
A: It is given that the statement about to the regression analysis. Here, need to find out the correct…
Q: Suppose a sample of 16 light trucks is randomly selected off the assembly line. The trucks are…
A: From the provided information, Sample size (n) = 16 Sample mean (x̄) = 22 Sample standard deviation…
Q: Briefly explain what is measured by the standard error of estimate
A: Given that what is measured by the standard error of estimate.
Q: (a) Find the standard error of the mean for each sampling situation (assuming a normal population).…
A: Given information We have given the 3-sampling situation, assuming a normal population. We have to…
Q: In an experiment to study the dependence of hypertension on smoking habits, the data below were…
A: The number of individuals is 167.
Q: Using your answer for MLE, consider the estimated regression line, given by y = ÔMLE T Which of the…
A: Regression line Y=a+bX
Q: The circumference of head sizes of newborns is approximately normal with mean 13.5 inches and…
A: Given Population mean μ=13.5, standard deviations σ=0.75
Q: Q2: (b) Let X₁, X2, X3 be uncorrelated random variables, having the same variance o². Consider the…
A: Given that X1,X2,X3 be uncorrelated random variables. That is,…
Q: The amount of time it takes an athlete to complete a Ninja warrior course is normally distributed…
A: Given that. X~N( μ , ?) μ=8.25 , ?=0.4 Z-score =( x - μ )/?
Q: Use the data in the following table, which lists drive-thru order accuracy at popular fast food…
A: Given problem Given that The orders are selected from the table. If one order is selected, we…
Q: The Joint Commission on Accreditation of Healthcare Organizations mandated that hospitals ban…
A: We have given that. Let px be the proportion of smokers from hospitals that implemented the ban who…
Q: A random sample of 26 items is drawn from a population whose standard deviation is unknown. The…
A: It is given that the sample mean is 860 and the sample standard deviation is 20.
Q: A z-score of –1.6 has a corresponding Stanine score of:
A: To find: A z-score of –1.6 has a corresponding Stanine score of ?
Q: ) Construct a 90 percent confidence interval for the proportion of all depositors who ask for cash…
A: Given that Sample size n =43 Favorable cases x =24 Sample proportion p^=x/n =24/43 =0.5681
Q: researcher believes there is a difference in the mean number of days before visible results begin to…
A: Solution: Given information: k= 3 groups . Group 1 and Group 2 has 5 replicates or observation and…
Q: Is a weight loss program based on exercise just as effective as a program based on diet? The 54…
A: From the provided information, n1=54x1=35s1=9n2=41x2=29s2=10α=0.10
Q: This exercise requires the use of a statistical software package. The cotton aphid poses a threat to…
A: It is given that the variable y be the infestation rate, x1 be the mean temperature, and x2 be the…
Q: One-Sample T: Test of mu = 12 vs not = 12 Variable N 10 X Mean 12.564 StDev ? a) Fill in missing…
A: Note: According to Bartleby guidelines expert solve only one question and maximum three subpart of…
Q: Given the linear correlation coefficient r and the sample size n, determine the critical values of r…
A: Given r=0.543 , n=25, level of significance ɑ=0.05
V6

Step by step
Solved in 5 steps with 5 images

- In exercise 7, the data on y = annual sales ($1000s) for new customer accounts andx = number of years of experience for a sample of 10 salespersons provided the estimatedregression equation yˆ = 80 + 4x. For these data x = 7, o(xi − x)2 = 142, and s = 4.6098.a. Develop a 95% confidence interval for the mean annual sales for all salespersons withnine years of experience.b. The company is considering hiring Tom Smart, a salesperson with nine years of experience.Develop a 95% prediction interval of annual sales for Tom Smart.c. Discuss the differences in your answers to parts (a) and (b).Develop a 95% confidence interval for the population slope if the followingregression information are given: b1= 41.7, p-value = 0.02, and n = 35.Determine the point estimate of the population mean and margin of error for the confidence interval with lower bound of 8 and upper bound of 24. A. x=24, E=8 B. x=16, E=16 C. x=8, E=16 D. x=16, E=
- A U.S. Food Survey showed that Americans routinely eat beef in their diet. Suppose that in a study of 49 consumers in Illinois and 64 consumers in Texas the following results were obtained from two samples regarding average yearly beef consumption: Illinois Texas = 49 = 64 = 54.1lb = 60.4lb S1 = 7.0 S2 = 8.0 Develop a 95% confidence Interval Estimate for the difference between the two population means.An automotive company is considering two types of batteries for its automobile. Sample information on the life of the battery is collected for 20 batteries of type A and 20 batteries of type B. The summary statistics are XA = 40.21, xB = 39.53, SA = 1.23, and SB= 1.59. Assume the data on each battery are normally distributed and assume σA = σB.(a) Find a 95% confidence interval on μA – μB.(b) Draw some conclusion from (a) that provides some insight into whether A or B should be adopted.1. The following table illustrates the BMI for a number of patients recently enrolled in a study investigating the relationship between BMI and type 2 diabetes. Participant BMI (kg/m2) A 26.5 B 19.2 C 29.7 D 27.4 E 30.2 F 28.9 A) Assuming the participants can be considered to be normally distributed, and that they comefrom a population with a σ=2.4 kg/m2, calculate a 95% confidence interval for the mean BMI ofthe population for which they represent.B) Correctly interpret the confidence interval you found above.
- A confidence interval for the difference between the means of two normally distributed populations based on the following dependent samples is desired: Before After 6 8 12 14 8 9 10 13 6 7a. Find the margin of error for a 90% confidence level. b. Find the UCL and the LCL for a 90% confidence level. c. Find the width of a 95% confidence interval.1. Consider the following results for independent samples taken from two populations a. What is the point estimate of the difference between the two population proportions?b. Develop a 90% confidence interval for the difference between the two population proportions.c. Develop a 95% confidence interval for the difference between the two population proportionsfor a sample size of 12 and a 90% confidence interval, the t statistic used to estimate U would be.