5 6 7 8 9 10 11 12 13 14 15 16 17 18 19 20 21 22 3 4 5 CENTRA 10 11 12 13 14 16 17 18 19 20 6 8 10 10 15 15 15 16 18 18 20 20 24 25 25 28 28 29 95 98 96 94 85 93 84 92 89 96 90 86 85 76 86 80 78 84
5 6 7 8 9 10 11 12 13 14 15 16 17 18 19 20 21 22 3 4 5 CENTRA 10 11 12 13 14 16 17 18 19 20 6 8 10 10 15 15 15 16 18 18 20 20 24 25 25 28 28 29 95 98 96 94 85 93 84 92 89 96 90 86 85 76 86 80 78 84

MATLAB: An Introduction with Applications
6th Edition
ISBN:9781119256830
Author:Amos Gilat
Publisher:Amos Gilat
Chapter1: Starting With Matlab
Section: Chapter Questions
Problem 1P

Related questions
Question
If the researcher wants to do a 2 tailed hypothesis test based on the data to generalize the relationship, what would the null and alternative hypothesis be? (in words and symbol notation).
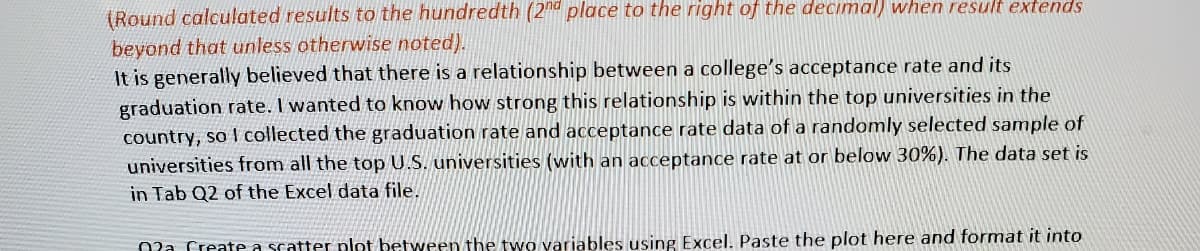
Transcribed Image Text:(Round calculated results to the hundredth (2nd place to the right of the decimal) when result extends
beyond that unless otherwise noted).
It is generally believed that there is a relationship between a college's acceptance rate and its
graduation rate. I wanted to know how strong this relationship is within the top universities in the
country, so I collected the graduation rate and acceptance rate data of a randomly selected sample of
universities from all the top U.S. universities (with an acceptance rate at or below 30%). The data set is
in Tab Q2 of the Excel data file.
Ola Create a scatter plot between the two variables using Excel. Paste the plot here and format it into
Transcribed Image Text:1
2
3
4
5
6
7
8
A
B
C
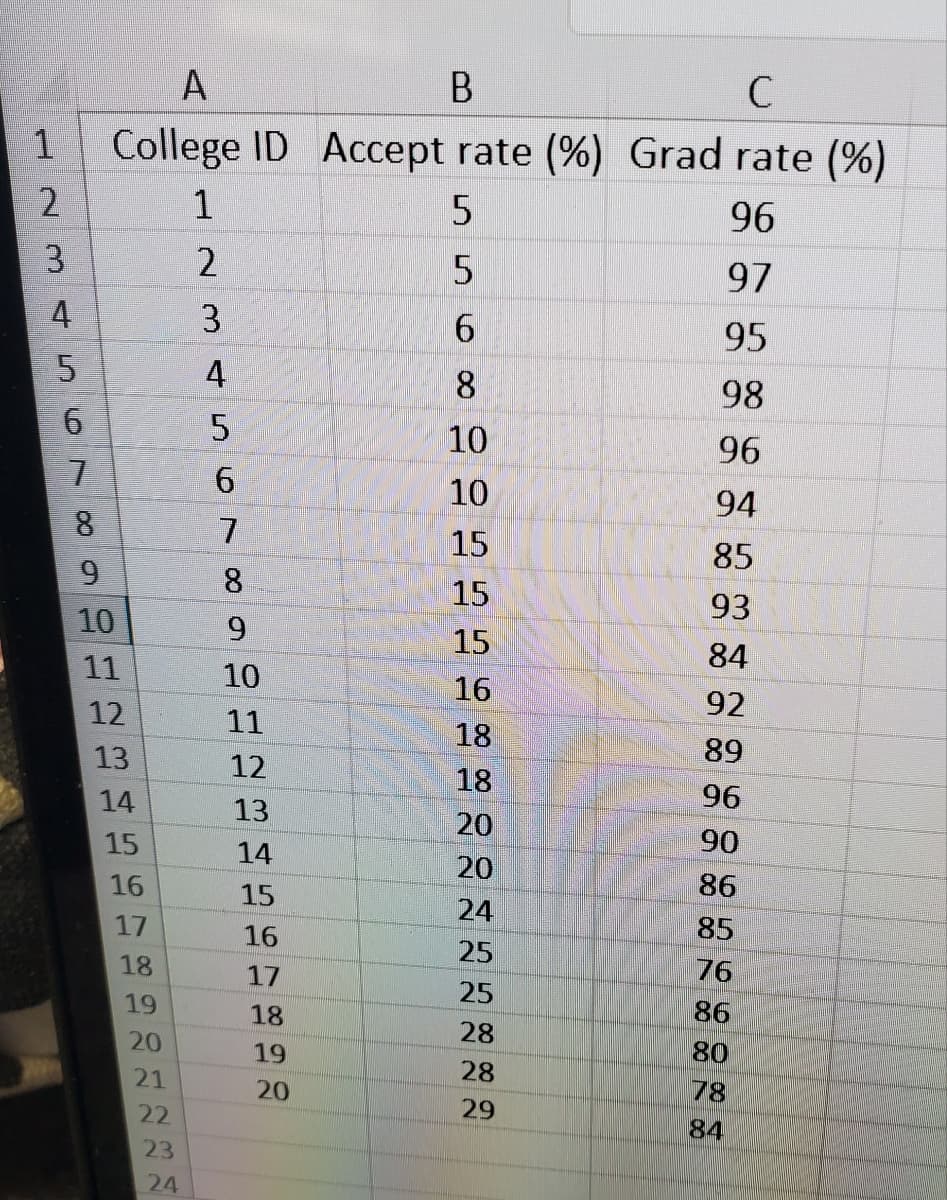
College ID Accept rate (%) Grad rate (%)
1
5
96
5
97
6
95
8
98
10
96
10
94
15
85
15
93
15
84
16
92
18
89
18
96
20
90
20
86
24
85
25
76
25
86
80
78
84
9
10
11
12
13
14
15
16
17
18
19
20
7222
21
22
23
34
24
568LOSA EN
2
3
4
7
9
10
11
12
13
14
15
16
17
18
19
20
28
28
29
Expert Solution
This question has been solved!
Explore an expertly crafted, step-by-step solution for a thorough understanding of key concepts.

This is a popular solution!

Trending now
This is a popular solution!

Step by step
Solved in 2 steps with 2 images

Follow-up Questions
Read through expert solutions to related follow-up questions below.
Follow-up Question

Transcribed Image Text:(Round calculated results to the hundredth (2nd place to the right of the decimal) when result extends
beyond that unless otherwise noted).
It is generally believed that there is a relationship between a college's acceptance rate and its
graduation rate. I wanted to know how strong this relationship is within the top universities in the
country, so I collected the graduation rate and acceptance rate data of a randomly selected sample of
universities from all the top U.S. universities (with an acceptance rate at or below 30%). The data set is
in Tab Q2 of the Excel data file.
Ola Create a scatter plot between the two variables using Excel. Paste the plot here and format it into

Transcribed Image Text:1
2
3
4
5
6
7
8
A
B
C
College ID Accept rate (%) Grad rate (%)
1
5
96
5
97
6
95
8
98
10
96
10
94
15
85
15
93
15
84
16
92
18
89
18
96
20
90
20
86
24
85
25
76
25
86
80
78
84
9
10
11
12
13
14
15
16
17
18
19
20
7222
21
22
23
34
24
568LOSA EN
2
3
4
7
9
10
11
12
13
14
15
16
17
18
19
20
28
28
29
Solution
Recommended textbooks for you
MATLAB: An Introduction with Applications
Statistics
ISBN:
9781119256830
Author:
Amos Gilat
Publisher:
John Wiley & Sons Inc

Probability and Statistics for Engineering and th…
Statistics
ISBN:
9781305251809
Author:
Jay L. Devore
Publisher:
Cengage Learning

Statistics for The Behavioral Sciences (MindTap C…
Statistics
ISBN:
9781305504912
Author:
Frederick J Gravetter, Larry B. Wallnau
Publisher:
Cengage Learning
MATLAB: An Introduction with Applications
Statistics
ISBN:
9781119256830
Author:
Amos Gilat
Publisher:
John Wiley & Sons Inc
Probability and Statistics for Engineering and th…
Statistics
ISBN:
9781305251809
Author:
Jay L. Devore
Publisher:
Cengage Learning
Statistics for The Behavioral Sciences (MindTap C…
Statistics
ISBN:
9781305504912
Author:
Frederick J Gravetter, Larry B. Wallnau
Publisher:
Cengage Learning

Elementary Statistics: Picturing the World (7th E…
Statistics
ISBN:
9780134683416
Author:
Ron Larson, Betsy Farber
Publisher:
PEARSON

The Basic Practice of Statistics
Statistics
ISBN:
9781319042578
Author:
David S. Moore, William I. Notz, Michael A. Fligner
Publisher:
W. H. Freeman

Introduction to the Practice of Statistics
Statistics
ISBN:
9781319013387
Author:
David S. Moore, George P. McCabe, Bruce A. Craig
Publisher:
W. H. Freeman