5) An educational researcher is investigating whether there is a significant difference in the test scores of two different teaching methods, Method A and Method B. The following table displays the test scores of students in both groups. . Conduct a two-sample t-test at a significance level of 1% to analyze the data: Method A 85 90 88 92 87 Method B 88 85 89 87 90
5) An educational researcher is investigating whether there is a significant difference in the test scores of two different teaching methods, Method A and Method B. The following table displays the test scores of students in both groups. . Conduct a two-sample t-test at a significance level of 1% to analyze the data: Method A 85 90 88 92 87 Method B 88 85 89 87 90

Holt Mcdougal Larson Pre-algebra: Student Edition 2012
1st Edition
ISBN:9780547587776
Author:HOLT MCDOUGAL
Publisher:HOLT MCDOUGAL
Chapter11: Data Analysis And Probability
Section11.4: Collecting Data
Problem 2E

Related questions
Question
Can someone please help? Thank you.
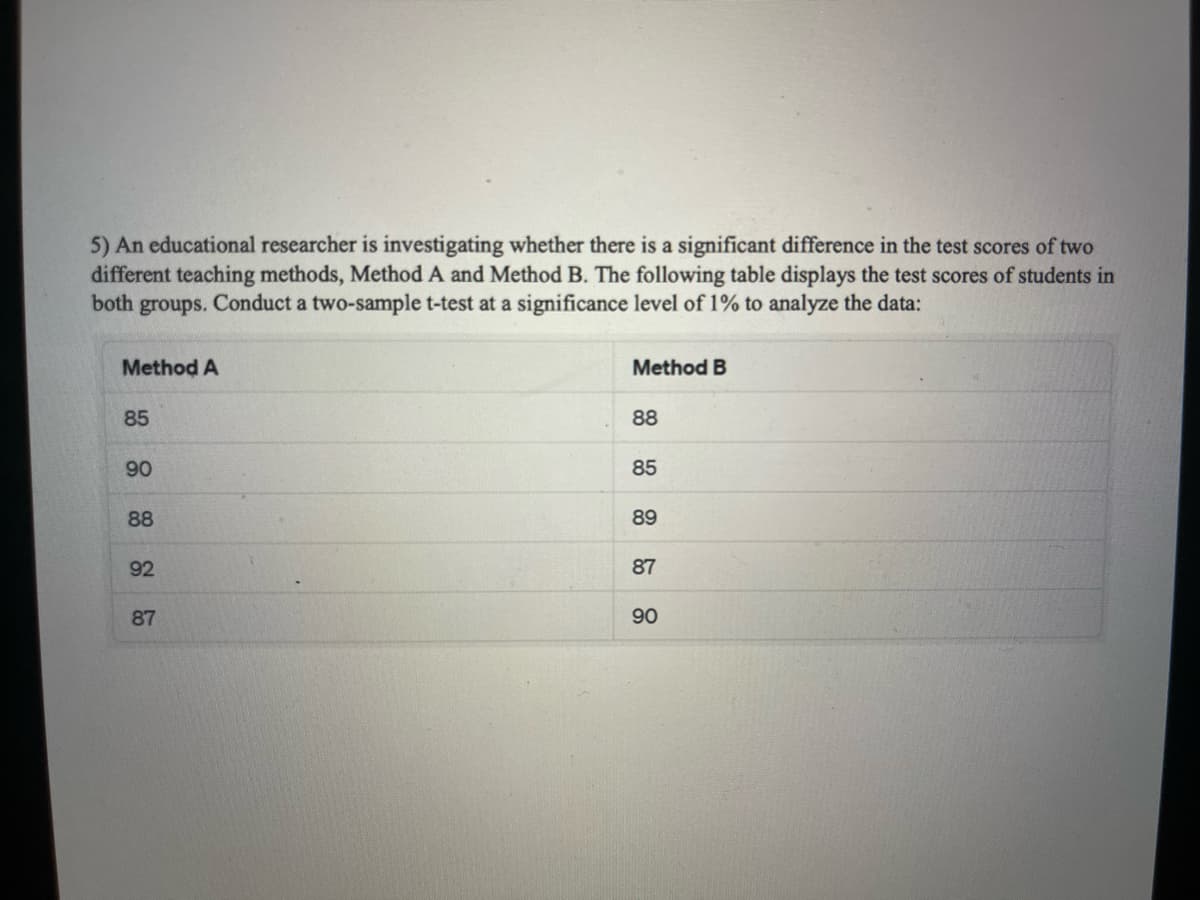
Transcribed Image Text:5) An educational researcher is investigating whether there is a significant difference in the test scores of two
different teaching methods, Method A and Method B. The following table displays the test scores of students in
both groups. Conduct a two-sample t-test at a significance level of 1% to analyze the data:
Method A
85
90
88
92
87
Method B
88
85
89
87
90
Expert Solution
This question has been solved!
Explore an expertly crafted, step-by-step solution for a thorough understanding of key concepts.

This is a popular solution!

Trending now
This is a popular solution!

Step by step
Solved in 3 steps with 11 images

Recommended textbooks for you
Holt Mcdougal Larson Pre-algebra: Student Edition…
Algebra
ISBN:
9780547587776
Author:
HOLT MCDOUGAL
Publisher:
HOLT MCDOUGAL

Glencoe Algebra 1, Student Edition, 9780079039897…
Algebra
ISBN:
9780079039897
Author:
Carter
Publisher:
McGraw Hill

College Algebra (MindTap Course List)
Algebra
ISBN:
9781305652231
Author:
R. David Gustafson, Jeff Hughes
Publisher:
Cengage Learning
Holt Mcdougal Larson Pre-algebra: Student Edition…
Algebra
ISBN:
9780547587776
Author:
HOLT MCDOUGAL
Publisher:
HOLT MCDOUGAL
Glencoe Algebra 1, Student Edition, 9780079039897…
Algebra
ISBN:
9780079039897
Author:
Carter
Publisher:
McGraw Hill
College Algebra (MindTap Course List)
Algebra
ISBN:
9781305652231
Author:
R. David Gustafson, Jeff Hughes
Publisher:
Cengage Learning