5 Position Type 6 Executives 7 Managers 8 Professionals 9 Interim 10 Total 11 12 Percentage per Month 13 Share 14 15 16 Monthly Dividend 17 Amount 18 Net Amount Net Dividend % (After 19 Deductions) 20 21 22 Position Type 23 Executives 24 Managers 25 Professionals 26 Interim 27 Total 28 29 30 Monthly Dividend 31 Amount 32 Net Amount Net Dividend % (After 33 Deductions) 34 35 Net dividends 35% + 27% January $ 98,348 50 $ 74,474.35 $ 31,330 21 $ 18,307.52 $ 222,460.58 $ $ $ $ $ $ $ $ January July 62% 98,000 $ 78,500 $ 31,000 $ $ 22,000 $ 229,500 $ Documentation July 8,032 50 $ 4,980.15 $ 62% February 89532.9 65742.12 29667.74 April 75279.26 52540.58 27274.09 15002 26 15721.80654 12382 1 199945.02 182459.6465 167476.03 February $ August 89,000 $ 65,000 $ 29,000 $ 15,000 $ 198,000 $ August 5,346.00 $ 3,314 52 $ Sales D E Monthly sales March 81522.67 56330.69 28884.48 Dividends Paid April March $ Estimated Sales October September 90,000 $ 70,000 $ 30,000 $ 16,000 $ 206,000 $ September Estimated Dividends 7,210.00 $ 4,470 20 $ $ 92,000 $ 72,000 $ 31,000 $ 18,000 $ 213,000 $ October 7,455.00 $ 4,622 10 5 F May 91610 24 68080.67 27281.96 20009 22 206982.09 May November 94,000 $ 74,000 $ 33,000 $ 19,500 $ 220,500 $ June 97352.68 78107.76 30099.43 21272 37 226832.24 June December 91,500 $ 71,000 $ 30,000 $ 19,000 $ 211,500 $ November December 7,717 50 $ 7,402.50 4,784.85 $ 4,589.55 H Trend Trend Total 554,500 430,500 184,000 109,500 1,278,500 Trend S 5 Total 533,646 25 S $ Total Avg. Placements Estimates only 43 20 22 28 Total 43,163.50 26,761.37 M
5 Position Type 6 Executives 7 Managers 8 Professionals 9 Interim 10 Total 11 12 Percentage per Month 13 Share 14 15 16 Monthly Dividend 17 Amount 18 Net Amount Net Dividend % (After 19 Deductions) 20 21 22 Position Type 23 Executives 24 Managers 25 Professionals 26 Interim 27 Total 28 29 30 Monthly Dividend 31 Amount 32 Net Amount Net Dividend % (After 33 Deductions) 34 35 Net dividends 35% + 27% January $ 98,348 50 $ 74,474.35 $ 31,330 21 $ 18,307.52 $ 222,460.58 $ $ $ $ $ $ $ $ January July 62% 98,000 $ 78,500 $ 31,000 $ $ 22,000 $ 229,500 $ Documentation July 8,032 50 $ 4,980.15 $ 62% February 89532.9 65742.12 29667.74 April 75279.26 52540.58 27274.09 15002 26 15721.80654 12382 1 199945.02 182459.6465 167476.03 February $ August 89,000 $ 65,000 $ 29,000 $ 15,000 $ 198,000 $ August 5,346.00 $ 3,314 52 $ Sales D E Monthly sales March 81522.67 56330.69 28884.48 Dividends Paid April March $ Estimated Sales October September 90,000 $ 70,000 $ 30,000 $ 16,000 $ 206,000 $ September Estimated Dividends 7,210.00 $ 4,470 20 $ $ 92,000 $ 72,000 $ 31,000 $ 18,000 $ 213,000 $ October 7,455.00 $ 4,622 10 5 F May 91610 24 68080.67 27281.96 20009 22 206982.09 May November 94,000 $ 74,000 $ 33,000 $ 19,500 $ 220,500 $ June 97352.68 78107.76 30099.43 21272 37 226832.24 June December 91,500 $ 71,000 $ 30,000 $ 19,000 $ 211,500 $ November December 7,717 50 $ 7,402.50 4,784.85 $ 4,589.55 H Trend Trend Total 554,500 430,500 184,000 109,500 1,278,500 Trend S 5 Total 533,646 25 S $ Total Avg. Placements Estimates only 43 20 22 28 Total 43,163.50 26,761.37 M

Excel Applications for Accounting Principles
4th Edition
ISBN:9781111581565
Author:Gaylord N. Smith
Publisher:Gaylord N. Smith
Chapter25: Segment Income Statement (dept)
Section: Chapter Questions
Problem 2R

Related questions
Question
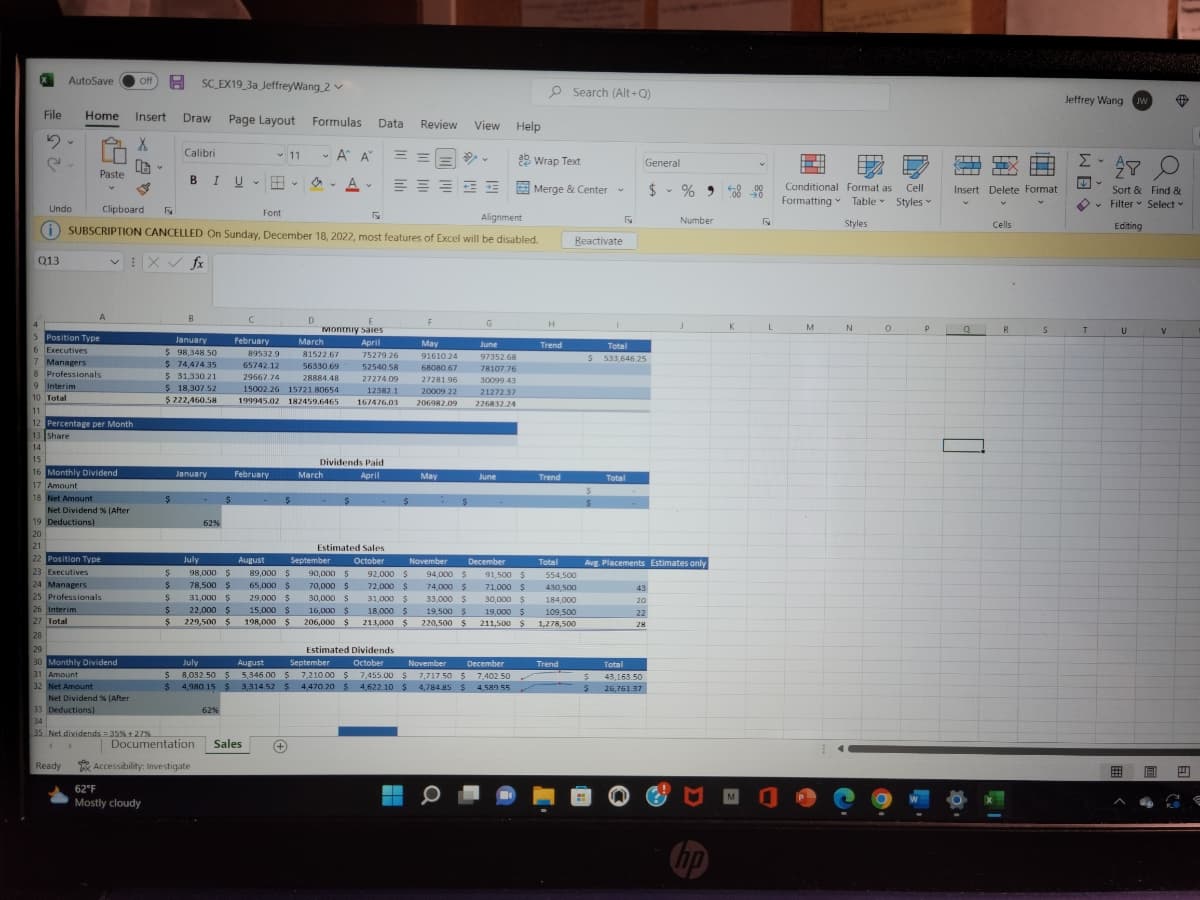
I need help to do questions 8, 9, and 11 for the Excel Worksheet. Also, please make sure that you provide the steps carefully and get to understand the work as possible. Those questions that I will provide you would be from Microsoft Word.
Transcribed Image Text:File
5
ल
e
Q13
14
15
AutoSave
Off H SC EX19 3a JeffreyWang 2 ✓
Home Insert Draw Page Layout Formulas Data Review
X
16
V
4
5 Position Type
6 Executives
7 Managers
Paste
8 Professionals
9 Interim
10 Total
11
12 Percentage per Month
13 Share
A
18 Net Amount
16 Monthly Dividend
17 Amount
19 Deductions)
20
Net Dividend % (After
Ready
21
22 Position Type
23 Executives
24 Managers
25 Professionals
26 Interim
27 Total
28
29
30 Monthly Dividend
31 Amount
32 Net Amount
Undo
Clipboard
F
Alignment
(i) SUBSCRIPTION CANCELLED On Sunday, December 18, 2022, most features of Excel will be disabled.
VEX✓ fx
Net Dividend % (After
33 Deductions)
34
35 Net dividends = 35% + 27%
$
62°F
Mostly cloudy
January
$ 98,348.50
$ 74,474.35
$ 31,330 21
$ 18,307.52
$ 222,460.58
$
$
$
Calibri
BIU
$
$
$
$
B
January
July
62%
98,000 $
78,500 $
Documentation
31,000 $
22,000 $
229,500 $
Accessibility: Investigate.
$
62%
C
✓11
Font
February
February
Sales
$
August
89,000 $
65,000 $
29,000 $
July
August
8,032.50 $ 5,346.00 $
4,980.15 $ 3,314.52 $
D
89532.9
March
81522.67
56330.69
65742 12
29667.74
28884.48
15002.26 15721.80654
27274.09
12382.1
199945.02 182459.6465 167476.03
V
-A A
15,000 $
198,000 $
+
V
A-
March
E
Monthly sales
April
75279.26
52540.58
-
Dividends Paid
April
Y
September
90,000 $
70,000 $
30,000 $
16,000 $
206,000 $
$
==
Estimated Sales
Estimated
September
7,210.00
7,210.00 $
4,470.20 $
October
92,000 $
72,000 $
31,000 $
18,000 $
213,000 $
Dividends
October
$
▬▬▬
F
May
91610 24
68080 67
View Help
Prv
May
June
97352.68
78107.76
27281.96
30099.43
20009.22
21272.37
206982.09 226832.24
November
94,000 $
74,000 $
33,000 $
19,500 $
220,500 $
G
June
November December
7,455.00
$
7,455.00 $ 7,717.50 $ 7,402.50
4,622.10 $ 4,784.85 $ 4,589.55
2Wrap Text
December
91,500 $
71,000 $
30,000 $
19,000 $
211,500 $
Merge & Center -
H
Trend
Trend
Search (Alt+Q)
Total
Trend
Reactivate
554,500
430,500
184,000
109,500
1,278,500
$
Total
$ 533,646.25
$
F
$
$
Total
General
$ % 508 0
43
20
Avg. Placements Estimates only
22
28
Total
43,163.50
26,761.37
V
Number
J
np
K
V
L
Conditional Format as Cell
Formatting Table Styles
Styles
M
N
0
P
←T
Insert Delete Format
Q
Cells
R
5
Jeffrey Wang
WB
Σ
T
V
JW #
Sort & Find &
Filter Select
Editing
U
⠀ 18
V
C €

Transcribed Image Text:AutoSave DIF H Instructions SC EX19_3a (2) Protected View Saved to this PC
File Home Insert Draw Design Layout
References Mailings
Review View Help
Be careful-files from the Internet can contain viruses. Unless you need to edit, it's safer to stay in Protected View.
i SUBSCRIPTION CANCELLED On Sunday, December 18, 2022, most features of Word will be disabled.
Reactivate
Shelly Cashman Excel 2019 | Module 3: SAM Project la
PROTECTED VIEW
Page 2 of 4
930 words
62°F
Mostly cloudy
Text Predictions: On
8.
9.
11
a.
13.
Lindsey wants to determine how the sales of each month contributed to the total sales.
Calculate this information for her as follows:
b.
C.
3.
Use the Fill Handle to fill the range C13:G13 with the formula in cell B13.
Lindsey also needs to calculate the dividends earned each month. If the company earns
$200,000 or more in a month, the dividend is 35% of the sales. If the company earns
less than $200,000 in a month, the dividend is 27% of the sales. Calculate the dividends
as follows:
b.
C.
d.
a.
O Search (Alt+Q)
b.
Enable Editing
10. Change the sparklines in the range H17:H18 as follows to use a more meaningful
format:
a.
In cell B13, insert a formula without using a function that divides the total sales for
January (cell B10) by the total sales to date (cell 110).
Use an absolute reference to cell 110 in the formula.
b.
In cell B17, enter a formula that uses the IF function and tests whether the total
sales for January (cell B10) is greater than or equal to 200000.
C.
If the condition is true, multiply the total sales for January (cell B10) by 0.35 to
calculate a dividend of 35%.
If the condition is false, multiply the total sales for January (cell B10) by 0.27 to
calculate a dividend of 27%.
Use the Fill Handle to fill the range C17:G17 with the formula in cell 817 to
calculate the dividends for February through June.
Lindsey would like to increase the average number of placements per month. Because
executive placements are the most profitable, Lindsey wants to know how many
executive placements she needs to reach the goal of 30 placements per month.
Use Goal Seek to set the average number of placements for all positions (cell 127) to
the value of 30 by changing the average number of executive placements (cell 123).
12. Format the text in cell 122 to clarify what it refers to as follows:
Change the Column sparklines to Line sparklines.
Apply the sparkline style Dark Gray, Sparkline Style Dark #3 (3rd column, 5th
row of the Sparkline Styles palette) to make the sparklines easier to see.
Merge and center the range J22:127.
Rotate the text down to 90 degrees in the merged cell so that the text reads from
top to bottom.
Change the width of column 3 to 6.00.
Delete row 35, which contains information Lindsey does not need anymore.
I
Jeffrey Wang JW
Focus
66
Comments
0
A
18
View
Expert Solution
This question has been solved!
Explore an expertly crafted, step-by-step solution for a thorough understanding of key concepts.

This is a popular solution!

Trending now
This is a popular solution!

Step by step
Solved in 2 steps with 4 images

Knowledge Booster


Learn more about
Need a deep-dive on the concept behind this application? Look no further. Learn more about this topic, finance and related others by exploring similar questions and additional content below.Recommended textbooks for you
Excel Applications for Accounting Principles
Accounting
ISBN:
9781111581565
Author:
Gaylord N. Smith
Publisher:
Cengage Learning

Excel Applications for Accounting Principles
Accounting
ISBN:
9781111581565
Author:
Gaylord N. Smith
Publisher:
Cengage Learning