5. A school administrator would like to investigate the performance of faculty in two departments based on the evaluation and feedback of the students. Assuming the sampling error is to be limited to no more than 8% and two sample sizes should be the same, how many students must be randomly selected for evaluations for each department? Use a 90% confidence level. ,
5. A school administrator would like to investigate the performance of faculty in two departments based on the evaluation and feedback of the students. Assuming the sampling error is to be limited to no more than 8% and two sample sizes should be the same, how many students must be randomly selected for evaluations for each department? Use a 90% confidence level. ,

College Algebra (MindTap Course List)
12th Edition
ISBN:9781305652231
Author:R. David Gustafson, Jeff Hughes
Publisher:R. David Gustafson, Jeff Hughes
Chapter8: Sequences, Series, And Probability
Section8.7: Probability
Problem 6E: List the sample space of each experiment. Tossing three coins

Related questions
Question
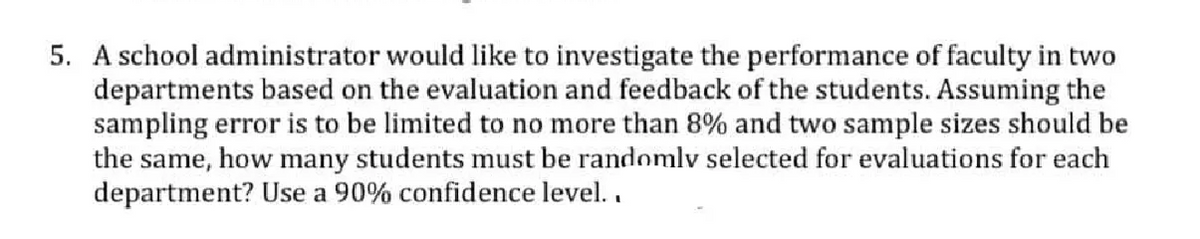
Transcribed Image Text:5. A school administrator would like to investigate the performance of faculty in two
departments based on the evaluation and feedback of the students. Assuming the
sampling error is to be limited to no more than 8% and two sample sizes should be
the same, how many students must be randomlv selected for evaluations for each
department? Use a 90% confidence level..
Expert Solution
This question has been solved!
Explore an expertly crafted, step-by-step solution for a thorough understanding of key concepts.

Step by step
Solved in 3 steps

Recommended textbooks for you
College Algebra (MindTap Course List)
Algebra
ISBN:
9781305652231
Author:
R. David Gustafson, Jeff Hughes
Publisher:
Cengage Learning

Holt Mcdougal Larson Pre-algebra: Student Edition…
Algebra
ISBN:
9780547587776
Author:
HOLT MCDOUGAL
Publisher:
HOLT MCDOUGAL
College Algebra (MindTap Course List)
Algebra
ISBN:
9781305652231
Author:
R. David Gustafson, Jeff Hughes
Publisher:
Cengage Learning
Holt Mcdougal Larson Pre-algebra: Student Edition…
Algebra
ISBN:
9780547587776
Author:
HOLT MCDOUGAL
Publisher:
HOLT MCDOUGAL