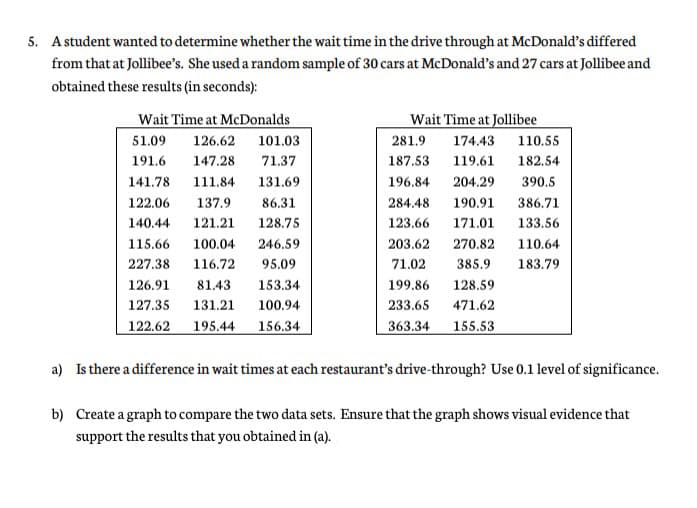
5. Astudent wanted to determine whether the wait time in the drive through at McDonald's differed from that at Jollibee's. She used a random sample of 30 cars at McDonald's and 27 cars at Jollibee and obtained these results (in seconds): Wait Time at McDonalds Wait Time at Jollibee 51.09 126.62 101.03 281.9 174.43 110.55 191.6 147.28 71.37 187.53 119.61 182.54 141.78 111.84 131.69 196.84 204.29 390.5 122.06 137.9 86.31 284.48 190.91 386.71 140.44 121.21 128.75 123.66 171.01 133.56 115.66 100.04 246.59 203.62 270.82 110.64 227.38 116.72 95.09 71.02 385.9 183.79 126.91 81.43 153.34 199.86 128.59 127.35 131.21 100.94 233.65 471.62 122.62 195.44 156.34 363.34 155.53 a) Is there a difference in wait times at each restaurant's drive-through? Use 0.1 level of significance. b) Create a graph to compare the two data sets. Ensure that the graph shows visual evidence that support the results that you obtained in (a).
5. Astudent wanted to determine whether the wait time in the drive through at McDonald's differed from that at Jollibee's. She used a random sample of 30 cars at McDonald's and 27 cars at Jollibee and obtained these results (in seconds): Wait Time at McDonalds Wait Time at Jollibee 51.09 126.62 101.03 281.9 174.43 110.55 191.6 147.28 71.37 187.53 119.61 182.54 141.78 111.84 131.69 196.84 204.29 390.5 122.06 137.9 86.31 284.48 190.91 386.71 140.44 121.21 128.75 123.66 171.01 133.56 115.66 100.04 246.59 203.62 270.82 110.64 227.38 116.72 95.09 71.02 385.9 183.79 126.91 81.43 153.34 199.86 128.59 127.35 131.21 100.94 233.65 471.62 122.62 195.44 156.34 363.34 155.53 a) Is there a difference in wait times at each restaurant's drive-through? Use 0.1 level of significance. b) Create a graph to compare the two data sets. Ensure that the graph shows visual evidence that support the results that you obtained in (a).

College Algebra (MindTap Course List)
12th Edition
ISBN:9781305652231
Author:R. David Gustafson, Jeff Hughes
Publisher:R. David Gustafson, Jeff Hughes
Chapter8: Sequences, Series, And Probability
Section8.7: Probability
Problem 5E: List the sample space of each experiment. Rolling one die and tossing one coin

Related questions
Topic Video
Question
Transcribed Image Text:5. Astudent wanted to determine whether the wait time in the drive through at McDonald's differed
from that at Jollibee's. She used a random sample of 30 cars at McDonald's and 27 cars at Jollibee and
obtained these results (in seconds):
Wait Time at McDonalds
Wait Time at Jollibee
51.09
126.62
101.03
281.9
174.43 110.55
191.6
147.28
71.37
187.53
119.61
182.54
141.78
111.84
131.69
196.84
204.29
390.5
122.06
137.9
86.31
284.48
190.91
386.71
140.44
121.21
128.75
123.66
171.01
133.56
115.66
100.04
246.59
203.62
270.82
110.64
227.38
116.72
95.09
71.02
385.9
183.79
126.91
81.43
153.34
199.86
128.59
127.35
131.21
100.94
233.65
471.62
122.62 195.44
156.34
363.34
155.53
a) Is there a difference in wait times at each restaurant's drive-through? Use 0.1 level of significance.
b) Create a graph to compare the two data sets. Ensure that the graph shows visual evidence that
support the results that you obtained in (a).
Expert Solution
This question has been solved!
Explore an expertly crafted, step-by-step solution for a thorough understanding of key concepts.

Step by step
Solved in 2 steps with 1 images

Knowledge Booster


Learn more about
Need a deep-dive on the concept behind this application? Look no further. Learn more about this topic, statistics and related others by exploring similar questions and additional content below.Recommended textbooks for you
College Algebra (MindTap Course List)
Algebra
ISBN:
9781305652231
Author:
R. David Gustafson, Jeff Hughes
Publisher:
Cengage Learning

College Algebra (MindTap Course List)
Algebra
ISBN:
9781305652231
Author:
R. David Gustafson, Jeff Hughes
Publisher:
Cengage Learning