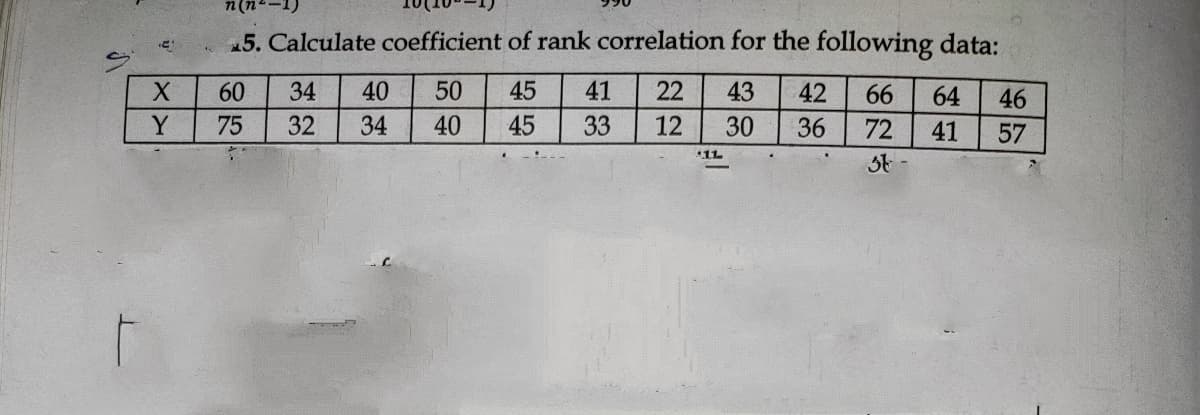
5. Calculate coefficient of rank correlation for the following data: 60 34 40 50 45 41 22 43 42 66 64 46 Y 75 32 34 40 45 33 12 30 36 72 41 57 小


Q: 10. Calculate the coefficient of correlation for the following data: 1000 1500 2000 2500 3000 500…
A: Correlation coefficient quantifies the strength and direction of relationship between variable. The…
Q: calculate the correlation coefficient by the Spearman rank correlation method and comment on the…
A:
Q: 3. Calculate the rank correlation coefficient and comment on its value. 65 120 50 55 65 50 55 60 50…
A: A rank correlation coefficient measures the degree of similarity between two rankings, and can be…
Q: Create a scatter plot for the following. 15 17 40 40 X у 19 38 O positive correlation O negative…
A: Scatterplot: A pictorial manner of showing the relationship between two non-causal factors is…
Q: Compute the Pearson correlation for the following data. X Y__ 23…
A: It is highly useful in statistics . It is used in correlation related problems .
Q: Calculate coefficient of correlation for the following data by short-cut 58 62 66 68 70
A: From the given sample data : n=7 , ƩX=450 , ƩY=436 , ƩX2=29188 , ƩY2=28070 , ƩXY=28376 Our aim is to…
Q: 4. Find out Spearman's Rank correlation for the following data and write your comment. Profits 65 54…
A: The table represents the difference between the ranks of each pair. Rank of X Rank of Y di di^2…
Q: Consider the following data: Marks in Statistics 300 400 450 100 200 600 | 200 550 200 | 250 Marks…
A: Obtain the value of the spearman’s rank correlation coefficient. The value of the spearman’s rank…
Q: 2. Determine the correlation coefficient of two branches of a river with the following average flow…
A: Use the given data to form the excel table: X Y X*Y X*X Y*Y 225 232 52200 50625 53824…
Q: Is there a linear relationship between men's shoe size and how many ties they own? Draw a scatter…
A: Hello! As you have posted 2 different questions, we are answering the first question. In case you…
Q: Calculate the Regression Line and Correlation Coefficient for the following heights (inches) of…
A: Solution: 5. Let X be the height of father and Y be the height of their sons. From the given…
Q: Find the sample correlation coefficient of the following pairs of data: x = age (in years) 20…
A: Solution: The correlation coefficient can be calculated by using the following formula:
Q: Calculate Karl Pearson's coefficient of correlation for the following date. 24 29 19 14 30 19 27 30…
A:
Q: The following tables gives the ages and blood pressure of 10 women: Age in 56 42 36 47 49 42 72 63…
A: Given Information: X 56 42 36 47 49 42 72 63 55 60 Y 147 125 118 128 145 140 155 160 149 150…
Q: Height |(feet) 5.3 Weight (Ibs) 140 5.7 150 130 5.3 6 200 100 5.2 130 5.1 120 120 5.2 5.7 180 5.5…
A: Hight (X):-5.3, 5.7, 5.3, 6, 5, 5.2, 5.1, 5.2, 5.7, 5.5, 5.4, 5.6 Weight (Y) :-140, 150, 130, 200,…
Q: Use the computing formula to calculate the coefficient of correlation for the vending machine data…
A: Correlation Coefficient : The correlation coefficient gives the measure of strength of the linear…
Q: 7. Find the rank correlation coefficient from the following : 50 50 55 60 65 65 65 60 60 50 Y 11 13…
A: We know that Rank correlation coefficients (rs) rs= SSXY/√SSXX*SSYY
Q: Based on the data shown below, calculate the correlation coefficient (rounded to three decimal…
A:
Q: Use the computing formula to calculate the coefficient of correlation for the vending machine data…
A: The following data for the X and Y variables are provided to find the sample correlation…
Q: Student 1 3. 4 8. Marks in 25 30 90 38 22 50 70 30 Economics Marks in 50 40 60 40 70 40 30…
A: Given, Let X be the marks in economics Let Y be the marks in statistics X Y 25 50 30 40 38…
Q: 6. Obtain the rank correlation coefficient for the following data: x 68 |64 y| 62 58 75 40 55 64 70…
A:
Q: (4) An emergency service wishes to see whether a relationship exists between the outside temperature…
A: a) Steps of create scatter Plot; 1. Enter the data in excel then, 2. Go to insert --- scatter plot…
Q: The following table shows the consumer príce index for medical care in the U.S. for years since…
A: Draw a straight line passing through almost all the points (Shown in the figure below). The…
Q: 50 30 20 8 10 12 14 16 O 0.68 O -0.87 O -0.15 0.63 0.98
A:
Q: Based on the data shown below, calculate the correlation coefficient (to three de y 3. 14.61 18.28…
A: From given data, X Y X*Y X*X Y*Y 3 14.61 43.83 9 213.4521 4 18.28 73.12 16 334.1584 5 18.25…
Q: The following data represent the statistics grades along with scores on an intelligence test of 8…
A: Correlation: Correlation is the measure of association between two variables in which one variable…
Q: Use the data table below to answer the questions regarding the relationship between sit-ups (X) and…
A:
Q: Calculate the co-efficient of rank correlation from the following data. Price of Coffee Price of Tea…
A:
Q: Calculate the Spearman's rank correlation(r.). from the following data: Marks in Mathematies 35 46…
A: Obtain the value of the spearman’s rank correlation coefficient. The value of the spearman’s rank…
Q: Consider the following graph. What can you say about correlation of x and y? Course Grade vs.…
A: We have to identify correlation.
Q: A statistics professor wanted to know if there was a relationship between the midterm exam grade and…
A:
Q: Calculate coefficient of correlation by the concurrent deviation method Supply: Price: 112 125 126…
A:
Q: Calculate the coefficient of correlation for the following data by rank difference method: 75 88 95…
A:
Q: Calculate the coefficient of correlation from the following data by the Spearman's Rank difference…
A:
Q: Calculate rank correlation coefficient of the following data : 80 80 142 75 88 95 75 60 50 Y 120 120…
A: x rank of x y rank of y d = R(x)-R(y) d^2 75 5 120 4 -1 1 88 2 120 4 2 4 95 1 150 1 0 0 75…
Q: Suppose that a firm had the following profit and investment expenditures in each year from 2013-…
A: Given: Data for X: 55,48,46,43,24,53,55,63,65Data for Y: 45,47,35,31,28,53,50,50,61
Q: Calculate the coefficient of correlation for the ages of husband and wife : Age of husband Age of…
A: Given: Age of husband x Age of wife y 23 18 27 22 28 23 29 24 30 25 31 26 33 28…
Q: Estimate the correlation coefficient for the data plotted below. 45 40 35 30 25 20 15 10 5 0 0 10…
A: Given image is example of strong positive correlation.
Q: 3. The speed (in miles per hour) of 8 vehicles and their braking distance (in feet) when stopping on…
A: Correlation coefficient is given by,
Q: Find out the correlation coefficient by the concurrent deviation method: 84 80 86 86 88 102 100 110…
A:
Q: 4. Find out Spearman's Rank correlation for the following data and write your comment. Profits 65 54…
A: We have given that, The data set are:- X:- 65, 54, 46, 54, 38, 85, 46, 70, 68, 95 Y:- 55, 35, 40,…
Q: Calculate the coefficient of rank correlation from the following data:- X 60 34 40 50 45 41 22 43 42…
A:
Q: The following table shows the ages of people and the corresponding weight Age(year) 25 40 38 53…
A:
Q: Calculate the rank correlation coefficient for the following data: 82. 75 25 98 36 78 : 39 65 62 90…
A:
Q: 13. Calculate the Rank Coefficient of correlation of the following (Repeated Ranks), 59 data. : 80…
A:
Q: Calculate co-efficient of correlation from the following data : 500 1000 1500 2000 2500 3000 600…
A: Given: X 500 1000 1500 2000 2500 3000 3500 Y 100 200 300 400 500 600 700
Q: Based on the data shown below, calculate the correlation coefficient (rounded to three decimal…
A: Now to compute the Pearson’s correlation between the X and Y,we will use the below formula of…
Q: 4. Construct a scatter plot for the following set of data. variables? Grade in calculus (x) and…
A: Given data is x 78 85 94 90 82 87 77 88 87 y 80 85 95 89 81 84 78 88 86
Q: Calculate the correlation coefficient from the following data on hourly sales (x) and expenses (y)…
A: Given data, X Y X*Y X*X Y*Y 70 72 5040 4900 5184 66 68 4488 4356 4624 68 69 4692 4624…


Trending now
This is a popular solution!

Step by step
Solved in 2 steps with 2 images

- For a pearson correlation of r=-.85, a graph of the data should show _________ a) points widely scattered around a line that slopes upward to the right b) points widely scattered around a line that slopes downward to the right c) points clustered close to a line that sloped upward to the right d) points clustered close to a line that slopes downward to the rightSuppose Z ~ N(0,1). What is the correlation between Z and |Z|(b) Find the correlation coefficient. (c-1) To test the correlation coefficient for significance at α = 0.1, fill in the following Noodles & Company Sales Growth and Loyalty Card Sales (n = 74 restaurants) Annual Sales Growth (%) Loyalty Card % of Net Sales Restaurant Growth% Loyalty% 1 -6.6 1.9 2 -6.2 2.3 3 -6.1 2.2 4 -5.9 2 5 -3.8 2.3 6 -1.9 1.7 7 -1.9 1.9 8 -1.8 1.3 9 -0.9 1.6 10 -0.5 2.3 11 0.4 1.9 12 0.4 1.4 13 0.6 2.3 14 0.8 2.2 15 0.8 2 16 1 1.6 17 1.8 1.3 18 2 2.4 19 4 0.7 20 4.2 1.4 21 4.3 2.4 22 4.3 1.2 23 4.4 2.5 24 4.6 2.7 25 5 1.5 26 5.2 1.7 27 5.3 1.5 28 5.7 1.9 29 5.8 2.5 30 6 1.8 31 6.4 2.2 32 6.6 1.5 33 6.6 2 34 6.7 1.4 35 6.8 2 36 7.2 2 37 7.3 2.3 38 7.4 1.2 39 7.5 1.7 40 7.5 2 41 7.5 1.4 42 7.6 1.2 43 7.6 1.9 44 7.9 1.9 45 8.1 1.7 46 8.3 2.7 47 8.7 0.7 48 8.9 2 49 8.9 1.3 50 8.9 2.2 51 9.2 1.7 52 10.8 1.8 53 10.9 1.5 54 10.9 1.6…
- Q1 - Returns on stocks X and Y are listed below: Period 1 2 3 4 5 6 7Stock X 6% 5% -2% 10% 3% 8% -4%Stock Y 11% 7% 10% -2% 3% 5% -1% What is the correlation of returns on the two stocks? Please round your answer to the nearest hundredth.Calculate the linear correlation coefficient for the data below. X -14 -12 -5 -8 -10 -11 -9 -7 -6 -13 Y -7 -5 12 4 1 -3 2 6 9 -5