5. Calculate the test statistic for this procedure. 20.9328

Functions and Change: A Modeling Approach to College Algebra (MindTap Course List)
6th Edition
ISBN:9781337111348
Author:Bruce Crauder, Benny Evans, Alan Noell
Publisher:Bruce Crauder, Benny Evans, Alan Noell
Chapter5: A Survey Of Other Common Functions
Section5.3: Modeling Data With Power Functions
Problem 6E: Urban Travel Times Population of cities and driving times are related, as shown in the accompanying...

Related questions
Question
100%
I need help with number 5 only please!
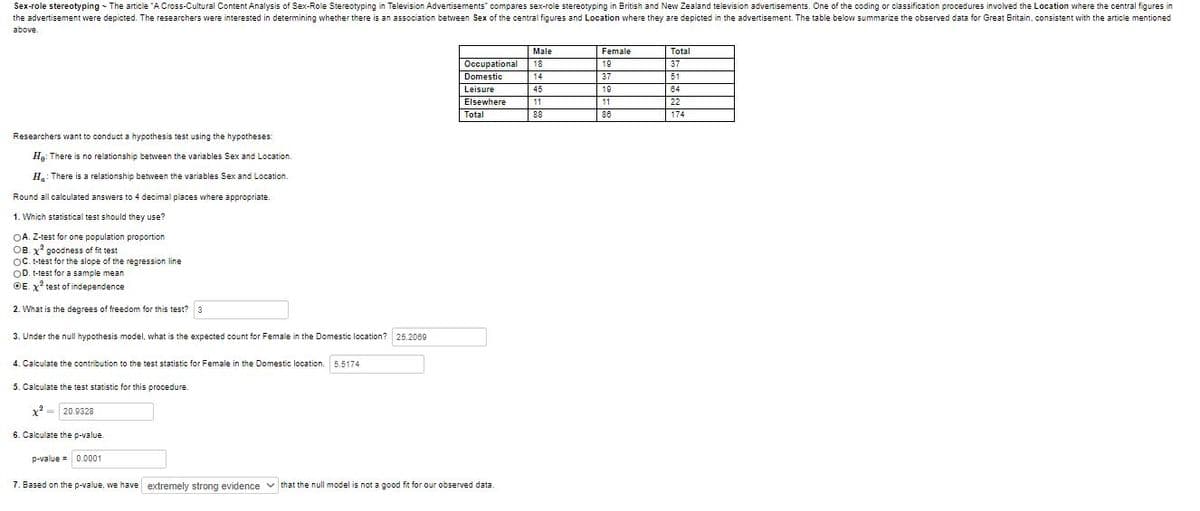
Transcribed Image Text:Sex-role stereotyping - The article "A Cross-Cultural Content Analysis of Sex-Role Stereotyping in Television Advertisements" compares sex-role stereotyping in British and New Zealand television advertisements. One of the coding or classification procedures involved the Location where the central figures in
the advertisement were depicted. The researchers were interested in determining whether there is an association between Sex of the central figures and Location where they are depicted in the advertisement. The table below summarize the observed data for Great Britain, consistent with the article mentioned
above
Male
Female
Total
Occupationa
Domestic
18
19
37
14
37
51
Leisure
45
19
64
11
| 22
174
Elsewhere
11
Total
88
86
Researchers want to conduct a hypothesis test using the hypotheses:
Hg: There is no relationship between the variables Sex and Location.
H: There is a relationship between the variables Sex and Location.
Round all calculated answers to 4 decimal places where appropriate.
1. Which statistical test should they use?
OA. Z-test for one population proportion
OB. x goodness of fit test
OC. t-test for the slope of the regression line
OD. t-test for a sample mean
OE. x test of independence
2. What is the degrees of freedom for this test? 3
3. Under the null hypothesis model, what is the expected count for Female in the Domestic location?
25.2069
4. Calculate the contribution to the test statistic for Female in the Domestic location. 5.5174
5. Calculate the test statistic for this procedure
x2 = 20.9328
6. Calculate the p-value.
p-value = 0.0001
7. Based on the p-value, we have extremely strong evidence v that the null model is not a good fit for our observed data.
Expert Solution
This question has been solved!
Explore an expertly crafted, step-by-step solution for a thorough understanding of key concepts.

Step by step
Solved in 3 steps with 4 images

Knowledge Booster


Learn more about
Need a deep-dive on the concept behind this application? Look no further. Learn more about this topic, statistics and related others by exploring similar questions and additional content below.Recommended textbooks for you
Functions and Change: A Modeling Approach to Coll…
Algebra
ISBN:
9781337111348
Author:
Bruce Crauder, Benny Evans, Alan Noell
Publisher:
Cengage Learning

Glencoe Algebra 1, Student Edition, 9780079039897…
Algebra
ISBN:
9780079039897
Author:
Carter
Publisher:
McGraw Hill

Big Ideas Math A Bridge To Success Algebra 1: Stu…
Algebra
ISBN:
9781680331141
Author:
HOUGHTON MIFFLIN HARCOURT
Publisher:
Houghton Mifflin Harcourt
Functions and Change: A Modeling Approach to Coll…
Algebra
ISBN:
9781337111348
Author:
Bruce Crauder, Benny Evans, Alan Noell
Publisher:
Cengage Learning
Glencoe Algebra 1, Student Edition, 9780079039897…
Algebra
ISBN:
9780079039897
Author:
Carter
Publisher:
McGraw Hill
Big Ideas Math A Bridge To Success Algebra 1: Stu…
Algebra
ISBN:
9781680331141
Author:
HOUGHTON MIFFLIN HARCOURT
Publisher:
Houghton Mifflin Harcourt