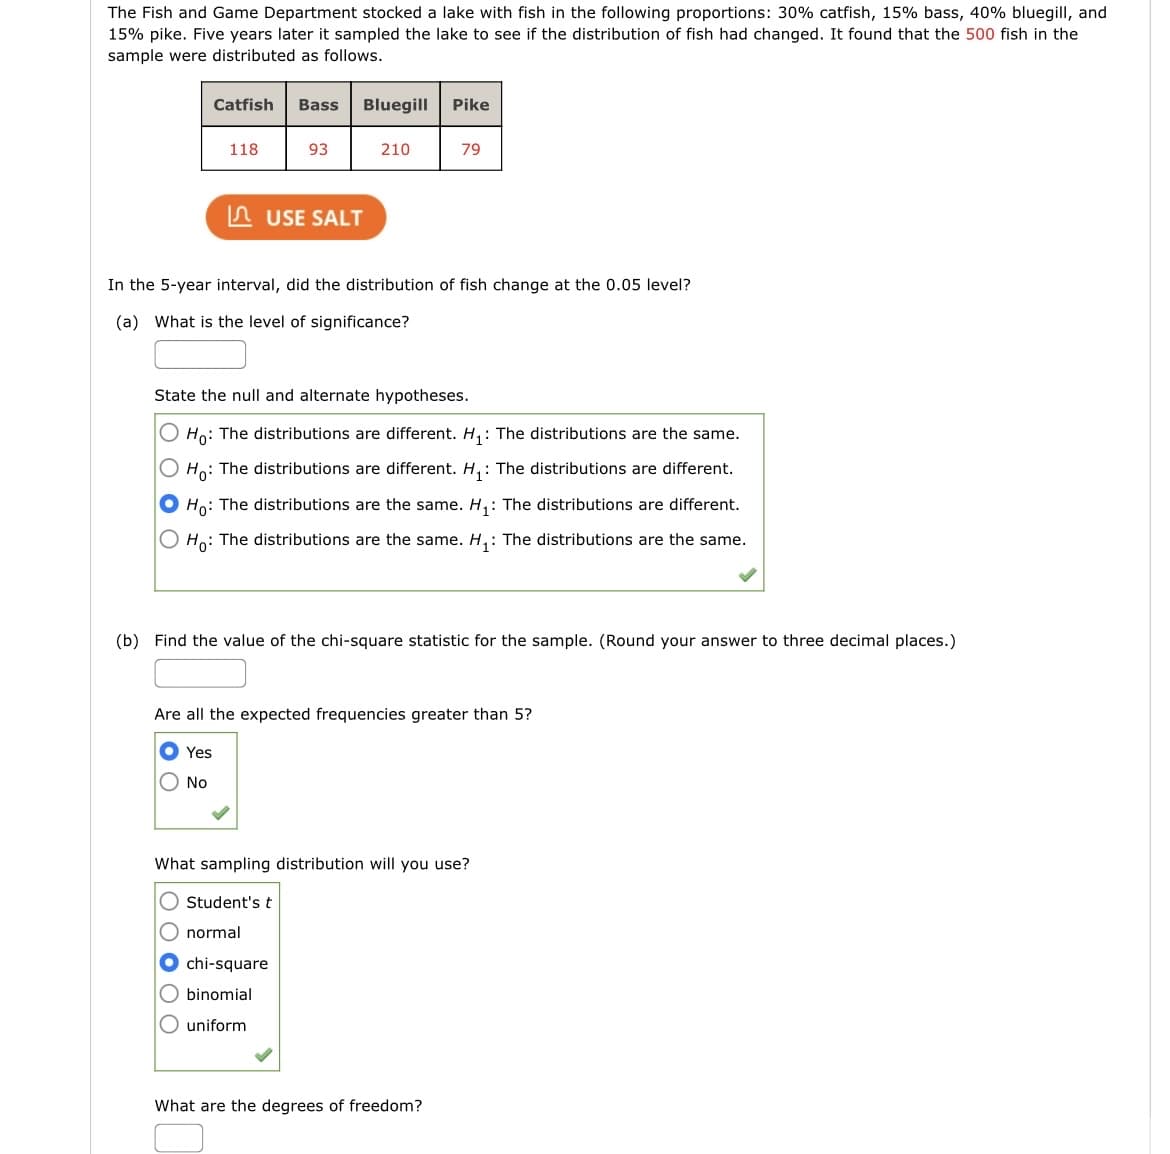
The Fish and Game Department stocked a lake with fish in the following proportions: 30% catfish, 15% bass, 40% bluegill, and 15% pike. Five years later it sampled the lake to see if the distribution of fish had changed. It found that the 500 fish in the sample were distributed as follows. Catfish Bass Bluegill Pike 118 93 210 79 A USE SALT In the 5-year interval, did the distribution of fish change at the 0.05 level? (a) What is the level of significance? State the null and alternate hypotheses. O Ho: The distributions are different. H, : The distributions are the same. O Ho: The distributions are different. H, : The distributions are different. O Ho: The distributions are the same. H,: The distributions are different. O Ho: The distributions are the same. H,: The distributions are the same. (b) Find the value of the chi-square statistic for the sample. (Round your answer to three decimal places.) Are all the expected frequencies greater than 5? Yes No What sampling distribution will you use? O Student's t O normal O chi-square O binomial O uniform What are the degrees of freedom?
The Fish and Game Department stocked a lake with fish in the following proportions: 30% catfish, 15% bass, 40% bluegill, and 15% pike. Five years later it sampled the lake to see if the distribution of fish had changed. It found that the 500 fish in the sample were distributed as follows. Catfish Bass Bluegill Pike 118 93 210 79 A USE SALT In the 5-year interval, did the distribution of fish change at the 0.05 level? (a) What is the level of significance? State the null and alternate hypotheses. O Ho: The distributions are different. H, : The distributions are the same. O Ho: The distributions are different. H, : The distributions are different. O Ho: The distributions are the same. H,: The distributions are different. O Ho: The distributions are the same. H,: The distributions are the same. (b) Find the value of the chi-square statistic for the sample. (Round your answer to three decimal places.) Are all the expected frequencies greater than 5? Yes No What sampling distribution will you use? O Student's t O normal O chi-square O binomial O uniform What are the degrees of freedom?

Glencoe Algebra 1, Student Edition, 9780079039897, 0079039898, 2018
18th Edition
ISBN:9780079039897
Author:Carter
Publisher:Carter
Chapter10: Statistics
Section10.6: Summarizing Categorical Data
Problem 10CYU

Related questions
Question
Transcribed Image Text:The Fish and Game Department stocked a lake with fish in the following proportions: 30% catfish, 15% bass, 40% bluegill, and
15% pike. Five years later it sampled the lake to see if the distribution of fish had changed. It found that the 500 fish in the
sample were distributed as follows.
Catfish
Bass
Bluegill
Pike
118
93
210
79
n USE SALT
In the 5-year interval, did the distribution of fish change at the 0.05 level?
(a) What is the level of significance?
State the null and alternate hypotheses.
O Ho: The distributions are different. H, : The distributions are the same.
Ho: The distributions are different. H,: The distributions are different.
O Ho: The distributions are the same. H,: The distributions are different.
O Ho: The distributions are the same. H,: The distributions are the same.
(b) Find the value of the chi-square statistic for the sample. (Round your answer to three decimal places.)
Are all the expected frequencies greater than 5?
Yes
O No
What sampling distribution will you use?
O Student'st
O normal
O chi-square
O binomial
uniform
What are the degrees of freedom?
Expert Solution
This question has been solved!
Explore an expertly crafted, step-by-step solution for a thorough understanding of key concepts.

Step by step
Solved in 4 steps

Recommended textbooks for you
Glencoe Algebra 1, Student Edition, 9780079039897…
Algebra
ISBN:
9780079039897
Author:
Carter
Publisher:
McGraw Hill

Holt Mcdougal Larson Pre-algebra: Student Edition…
Algebra
ISBN:
9780547587776
Author:
HOLT MCDOUGAL
Publisher:
HOLT MCDOUGAL
Glencoe Algebra 1, Student Edition, 9780079039897…
Algebra
ISBN:
9780079039897
Author:
Carter
Publisher:
McGraw Hill
Holt Mcdougal Larson Pre-algebra: Student Edition…
Algebra
ISBN:
9780547587776
Author:
HOLT MCDOUGAL
Publisher:
HOLT MCDOUGAL