5. Draw a vertical line through a normal distribution for each of the following z-score locations. Determine whether the tail is on the right or left side of the line and find the proportion in the tail. a. z = 1.00 b. z = 0.50
5. Draw a vertical line through a normal distribution for each of the following z-score locations. Determine whether the tail is on the right or left side of the line and find the proportion in the tail. a. z = 1.00 b. z = 0.50

MATLAB: An Introduction with Applications
6th Edition
ISBN:9781119256830
Author:Amos Gilat
Publisher:Amos Gilat
Chapter1: Starting With Matlab
Section: Chapter Questions
Problem 1P

Related questions
Question
I need help with question #5
Please
Transcribed Image Text:21:17
Q AA E .*
...
25.5
20
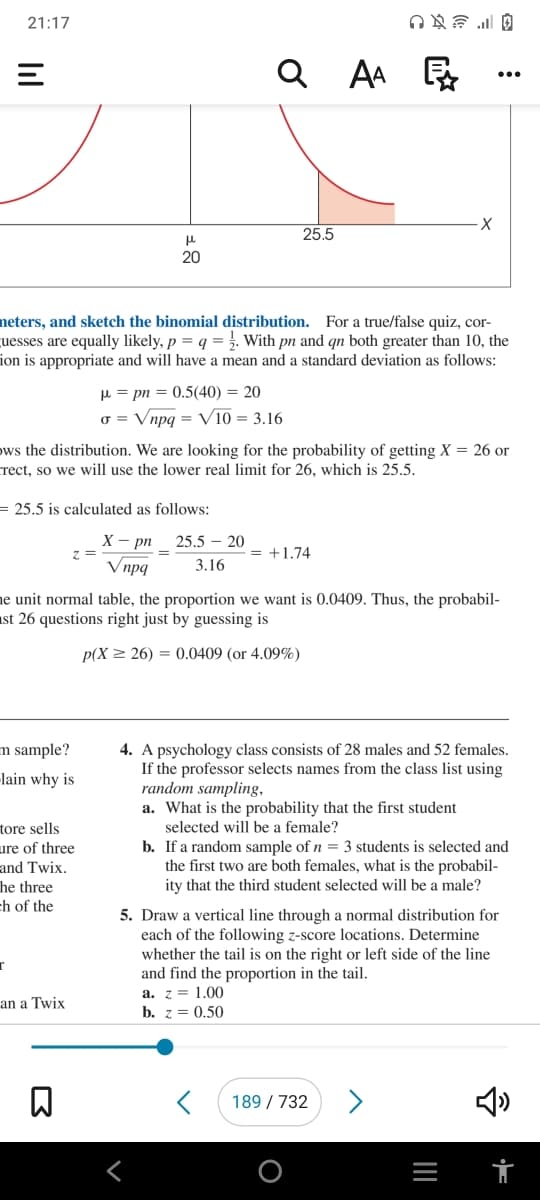
neters, and sketch the binomial distribution. For a true/false quiz, cor-
uesses are equally likely, p = q =. With pn and qn both greater than 10, the
ion is appropriate and will have a mean and a standard deviation as follows:
µ = pn = 0.5(40) = 20
o = Vnpg = V10 = 3.16
ows the distribution. We are looking for the probability of getting X = 26 or
crect, so we will use the lower real limit for 26, which is 25.5.
= 25.5 is calculated as follows:
X - pn
z =
Vnpq
25.5 – 20
= +1.74
3.16
ne unit normal table, the proportion we want is 0.0409. Thus, the probabil-
ast 26 questions right just by guessing is
p(X > 26) = 0.0409 (or 4.09%)
4. A psychology class consists of 28 males and 52 females.
If the professor selects names from the class list using
random sampling,
a. What is the probability that the first student
selected will be a female?
m sample?
-lain why is
tore sells
ure of three
and Twix.
he three
ch of the
b. If a random sample of n = 3 students is selected and
the first two are both females, what is the probabil-
ity that the third student selected will be a male?
5. Draw a vertical line through a normal distribution for
each of the following z-score locations. Determine
whether the tail is on the right or left side of the line
and find the proportion in the tail.
a. z = 1.00
b. z = 0.50
an a Twix
189 / 732
>
Expert Solution
This question has been solved!
Explore an expertly crafted, step-by-step solution for a thorough understanding of key concepts.

This is a popular solution!

Trending now
This is a popular solution!

Step by step
Solved in 3 steps with 2 images

Recommended textbooks for you
MATLAB: An Introduction with Applications
Statistics
ISBN:
9781119256830
Author:
Amos Gilat
Publisher:
John Wiley & Sons Inc

Probability and Statistics for Engineering and th…
Statistics
ISBN:
9781305251809
Author:
Jay L. Devore
Publisher:
Cengage Learning

Statistics for The Behavioral Sciences (MindTap C…
Statistics
ISBN:
9781305504912
Author:
Frederick J Gravetter, Larry B. Wallnau
Publisher:
Cengage Learning
MATLAB: An Introduction with Applications
Statistics
ISBN:
9781119256830
Author:
Amos Gilat
Publisher:
John Wiley & Sons Inc
Probability and Statistics for Engineering and th…
Statistics
ISBN:
9781305251809
Author:
Jay L. Devore
Publisher:
Cengage Learning
Statistics for The Behavioral Sciences (MindTap C…
Statistics
ISBN:
9781305504912
Author:
Frederick J Gravetter, Larry B. Wallnau
Publisher:
Cengage Learning

Elementary Statistics: Picturing the World (7th E…
Statistics
ISBN:
9780134683416
Author:
Ron Larson, Betsy Farber
Publisher:
PEARSON

The Basic Practice of Statistics
Statistics
ISBN:
9781319042578
Author:
David S. Moore, William I. Notz, Michael A. Fligner
Publisher:
W. H. Freeman

Introduction to the Practice of Statistics
Statistics
ISBN:
9781319013387
Author:
David S. Moore, George P. McCabe, Bruce A. Craig
Publisher:
W. H. Freeman