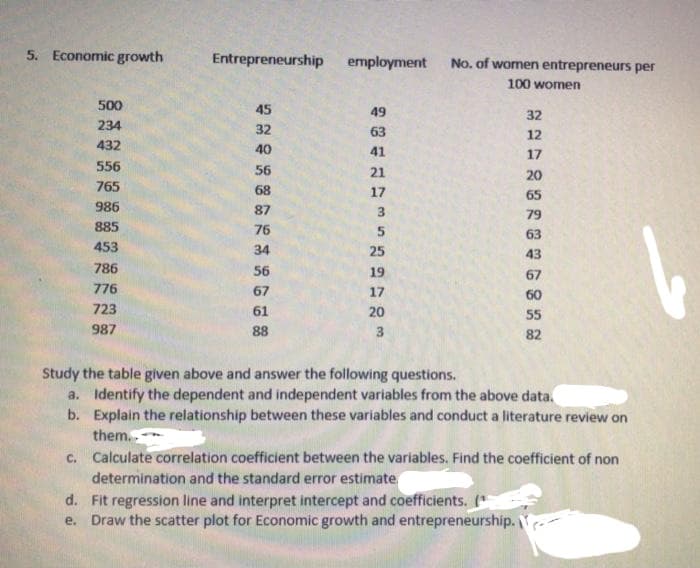
5. Economic growth Entrepreneurship employment No. of women entrepreneurs per 100 women 500 45 49 32 234 32 63 12 432 40 41 17 556 56 21 20 765 68 17 65 986 87 3. 79 885 76 63 453 34 25 43 786 56 19 67 776 67 17 60 723 61 20 55 987 88 3 82 Study the table given above and answer the following questions. a. Identify the dependent and independent variables from the above data. b. Explain the relationship between these variables and conduct a literature review on them. c. Calculate correlation coefficient between the variables. Find the coefficient of non determination and the standard error estimate d. Fit regression line and interpret intercept and coefficients. (* e. Draw the scatter plot for Economic growth and entrepreneurship.
5. Economic growth Entrepreneurship employment No. of women entrepreneurs per 100 women 500 45 49 32 234 32 63 12 432 40 41 17 556 56 21 20 765 68 17 65 986 87 3. 79 885 76 63 453 34 25 43 786 56 19 67 776 67 17 60 723 61 20 55 987 88 3 82 Study the table given above and answer the following questions. a. Identify the dependent and independent variables from the above data. b. Explain the relationship between these variables and conduct a literature review on them. c. Calculate correlation coefficient between the variables. Find the coefficient of non determination and the standard error estimate d. Fit regression line and interpret intercept and coefficients. (* e. Draw the scatter plot for Economic growth and entrepreneurship.

Glencoe Algebra 1, Student Edition, 9780079039897, 0079039898, 2018
18th Edition
ISBN:9780079039897
Author:Carter
Publisher:Carter
Chapter4: Equations Of Linear Functions
Section4.5: Correlation And Causation
Problem 11PPS

Related questions
Question
Transcribed Image Text:5. Economic growth
Entrepreneurship employment
No. of women entrepreneurs per
100 women
500
45
49
32
234
32
63
12
432
40
41
17
556
56
21
20
765
68
17
65
986
87
79
885
76
63
453
34
25
43
786
56
19
67
776
67
17
60
723
61
20
55
987
88
3
82
Study the table given above and answer the following questions.
a. Identify the dependent and independent variables from the above data.
b. Explain the relationship between these variables and conduct a literature review on
them.
c. Calculate correlation coefficient between the variables. Find the coefficient of non
determination and the standard error estimate
d. Fit regression line and interpret intercept and coefficients. (*
e. Draw the scatter plot for Economic growth and entrepreneurship.
Expert Solution
This question has been solved!
Explore an expertly crafted, step-by-step solution for a thorough understanding of key concepts.

Step by step
Solved in 3 steps with 1 images

Recommended textbooks for you
Glencoe Algebra 1, Student Edition, 9780079039897…
Algebra
ISBN:
9780079039897
Author:
Carter
Publisher:
McGraw Hill

Functions and Change: A Modeling Approach to Coll…
Algebra
ISBN:
9781337111348
Author:
Bruce Crauder, Benny Evans, Alan Noell
Publisher:
Cengage Learning
Glencoe Algebra 1, Student Edition, 9780079039897…
Algebra
ISBN:
9780079039897
Author:
Carter
Publisher:
McGraw Hill
Functions and Change: A Modeling Approach to Coll…
Algebra
ISBN:
9781337111348
Author:
Bruce Crauder, Benny Evans, Alan Noell
Publisher:
Cengage Learning