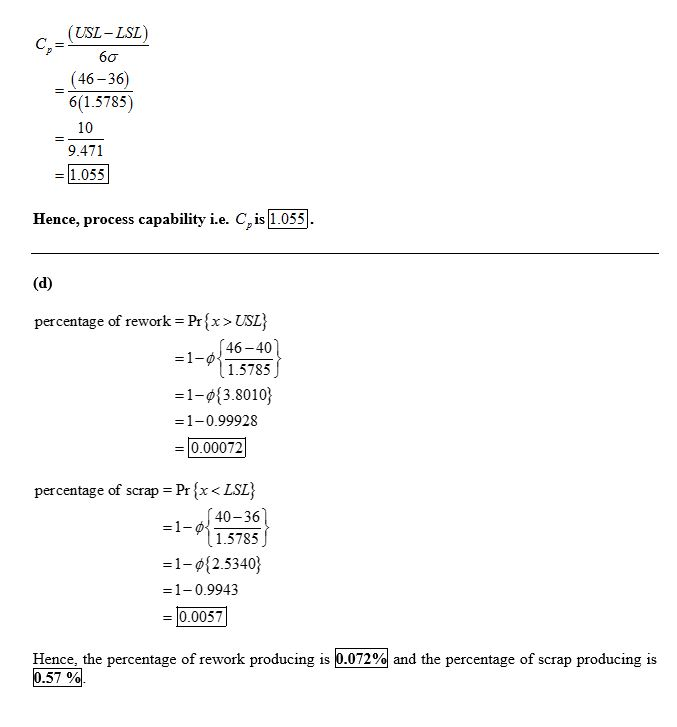
How do you derive the numbers .99928 and .9943 in part d of this question. I only need help with part d.


Q: The mean yield of two sets of plots and their variability are as given below. Examine whether the di...
A:
Q: 2. In a random sample of 87 college students, the average number of GroupMe messages handled in one ...
A: Given, In a random sample of 87 college students, The average number of GroupMe messages handled in ...
Q: Treatment A B 162 141 125 143 157 123 165 125 139 145 143 141 149 137 150 178 155 132 Sample 157 143...
A: For the given table using Anova single factor Complete Anova table and Hypotheses test at alpha =0.0...
Q: The random number generator program picks a number between 0 and 100 using a uniform distribution (w...
A: Introduction: Denote X as the random number obtained by the random number generator, between 0 and 1...
Q: Xand R charts are to be used to control a critical dimension on a certain product using a subgroup s...
A:
Q: Class Interval Frequency Class Marks Class Boundarieelative Frequen CF 20-26 12 23 19.5-26.5 0.12 12...
A: Given : Class interval Frequency Class Mark Class Boundaries Relative frequency <CF >CF 2...
Q: 3. Consider this data for the mass (in g) of a precipitate: 4.06, 4.00, 3.70, 3.95, and 4.02. (a) Co...
A: Given Information: Consider the data values: 4.06, 4.00, 3.70, 3.95 and 4.02. The mean and standar...
Q: 3. From his long standing experience, a farmer believes that the mean yield of grain per p his farm ...
A:
Q: The length of a shaft is maintained during production by statistical process control technique using...
A:
Q: Define Non parametric test. Discuss the advantages and disadvantages.
A:
Q: Find the sample variance and standard deviation. 4, 47, 14, 48, 32, 22, 34, 28, 27, 32
A: Given,4, 47, 14, 48, 32, 22, 34, 28, 27, 32 sample size(n)=10sample mean(x¯)=4+47+14+48+32+22+34+2...
Q: Suppose we know the following information about a set of bivariate data: (x²) =9.72 (y²) =10.69 (æy)...
A:
Q: A deck of Uno cards has 4 colors (suits): Red, Yellow, Green, Blue Each color has cards numbered 1 t...
A:
Q: The daily online newspaper America at a Glance has just published an article detailing a study of 50...
A: Given that In Histogram the proportion of Mathematics test score Find the the proportion of Mathe...
Q: Try and classify the following random variables as discrete or continuous. Each rande iable is assig...
A: Solution: Discrete variable: A discrete variable is the one which takes integral values and can on...
Q: Table 1: Vehicles Engine size Number Vehicle City MPG Hwy MPG Model Model Cylinders Transmission Fue...
A: Qualitative : Categoricals variables Variables that take on name or lebels and can fit into categori...
Q: A standardized exam's scores are normally distributed. In a recent year, the mean test score was 150...
A:
Q: Calculate the co-efficient of correlation and the lines of regression for the following data: x = 1 ...
A: Data given X=1,2,3,4,5,6,7,8,9 Y=9,8,10,12,11,13,14,16,15
Q: Determine whether the following graph can represent variable with a nomal distribution. Explain your...
A: Solution-: We determine the given graph can represent a variable with a normal distribution. Also fi...
Q: If the variable Z is normally distributed with mean equal to 0 and standard deviation equal to 1. T...
A: the variable Z is normally distributed with mean equal to 0 and standard deviation equal to 1.
Q: Determine whether the graph shown could represent a variable with a nomal distribution. Explain your...
A: It is needed to determine whether the given graph represents a normal distribution or not.
Q: Emotional Health Index Score Service Transportation Manufacturing or production - Sales Clerical or ...
A: Hiii
Q: A food snack manufacturer samples 11 bags of pretzels off the assembly line and weighs their content...
A:
Q: A principal of a college wants to estimate the proportion of smokers among his students. What size o...
A: From the provided information, Margin of error = 0.10 Proportion (p) = 0.3
Q: Based on the data shown below, calculate the regression line (each value to two decimal places) y...
A:
Q: gloves with glove powder on a daily basis are particularly susceptible to developing a latex allergy...
A: We have given that Sample size n =46 Sample mean =19.3 Sample standard deviation =11.9 95% confiden...
Q: The rank correlation coefficient of a debating contest involving 10 participants was calculated as 0...
A:
Q: Instruction: Covert the following in z scores and construct the normal curve 1. X = 80, X, = 85, u =...
A:
Q: The density function for a random variable X is f(x). The answer should be given to 4 decimal places...
A: Given, The pdf of a random variable X is f(x) = 2e-2xx>00elsewhere So, X is a continuous ran...
Q: Determine the three quartile values for blood cocaine concentration for both ED and Non-ED samples. ...
A:
Q: Manufacture of a certain component requires three different machining operations. Machining time for...
A: From the given information, H0:μ=65Ha:μ≠65 true average machine time is 66 minutes. sample size, n=1...
Q: Match the name of the sampling method descriptions given. Situations v asking people on the street w...
A: Sampling is the procedure of selecting a sample (or) individuals from the population. The well-known...
Q: The length of pregnancies are normally distributed with a mean of 266 days and a standard deviation ...
A: The mean is 266 and the standard deviation is 15.
Q: Vhat one ship d every l0 & wreelked, fiad probability that out of s Ship that ii expeted. to arcuee ...
A:
Q: For 10 observations on price (p) and supply (S) the following data were obtained (in appropriate uni...
A:
Q: Independent random samples taken on two university campuses revealed the following information conce...
A: Given Data : For Sample 1 x̄1 = 260 n1 = 50 σ1= 20 For Sample 2 ...
Q: An experimental determination of Pb in a bullet using ICP-OES was repeated 3 times. The mean and sta...
A: From the provided information, Sample size (n) = 3 Sample mean (x̄) = 0.034% Standard deviation (s) ...
Q: A coefficient of correlation of 0-2 is derived from a random sample of 625 pairs of Abservations: (i...
A: The association between the two variable is calculated using the correlation measure. It explains th...
Q: The average student loan debt for college graduates is $25,600. Suppose that that distribution is no...
A: Note- Giving solution for part (C) only. Given information Population mean μ = $25,600 Population ...
Q: 1. Birth weights of babies in the United States can be modeled by a normal distribution with mean 32...
A: Hi! Thank you for the question, As per the honor code, we are allowed to answer three sub-parts at a...
Q: A principal of a college wants to estimate the proportion of smokers among his students. What size o...
A:
Q: Question 21: Sara applied for visa to visit four different countries and let X be the number of acce...
A: Given that Probability mass function of X is x 0 1 2 3 4 P(x) 0.04 0.21 0.13 a 0.22
Q: Calculate Harmonic mean from the following values : 9, 17, 23, 42, 56, 67, 72.
A:
Q: 1) Using a computer, develop a regression model that could be used to predict starting salary based ...
A: " Since you have posted a question with multiple sub-parts, we will solve the first three subparts f...
Q: A drug test correctly gives a positive result 90 percent of the time. However, 3 percent of the time...
A:
Q: For the standard normal distribution shown on the right, find the probability of z occurring in the ...
A: Ans# Given a standard normal distribution In the shaded region P( Z > -0.94 ) = ?
Q: The number of reviews for each of the local bowling alleys are counted. The results are normally dis...
A: Here is given that mean is 25 and standard deviation is 4. We will use z-standard normal distributio...
Q: If the true mean is .9560 with a standard deviation of .0020 what is the sampling distribution of X
A: if the true mean is 0.9560 with a standard deviation of 0.0020 i.e. μ=0.9560 and σ = 0.0020
Q: Suppose that the speed at which cars go on the freeway is normally distributed with mean 73 mph and ...
A:
Q: 4.1. Walton's production line produces a variable number of defective parts in an hour, with probabi...
A:
How do you derive the numbers .99928 and .9943 in part d of this question. I only need help with part d.
Thank you.


Trending now
This is a popular solution!

Step by step
Solved in 2 steps with 1 images

- An independent research group is interested in showing that the percentage of babies delivered through the the Cesarian section decreases. For the past years, 20% of the babies were delivered through the Cesarian section. The research group randomly inspects the medical records of 144 births and finds that 25 of the births were by Cesarian section. Can the research group conclude that the percent of births by Cesarian section has decreased at 5% level of significance?A marriage counselor has traditionally seen that the proportion p of all married couples for whom her communication program can prevent divorce is 79%. After making some recent changes, the marriage counselor now claims that her program can prevent divorce in mot e than 79% of married couples. In a random sample of 225 married couples who completed her program, 194 of them stayed together. is there enougn evidence to suppore che marriage counselor's claim at the 0.10 level of sionificance:A medical researcher says that less than 80% of adults in a certain country think that healthy children should be required to be vaccinated. In a random sample of 200 adults in that country, 76% think that healthy children should be required to be vaccinated. At α=0.05, is there enough evidence to support the researcher's claim? Complete parts (a) through (e) below. Let p be the population proportion of successes, where a success is an adult in the country who thinks that healthy children should be required to be vaccinated. (a) Find the critical value(s) and identify the rejection region(s). z0=______ (b) Identify the rejection region(s). (c) Find the standardized test statistic z. z=______ (d) Decide whether to reject or fail to reject the null hypothesis and (e) interpret the decision in the context of the original claim.
- Historically, the proportion of people who trade in their old car to a car dealer when purchasing a new car is 48%. Over the previous 6 months, in a sample of 115 new-car buyers, 46 have traded in their old car. The p-value for the test of whether the proportion of people who trade in their old cars to a car dealer has decreased is 0.0427. If we were to test this hypothesis at the 5% level of signficance, what can you conclude concerning the null hypothesis?A certain training device measures reaction times of users by illuminating lights, one at a time, and measuring the time it takes the user to press each light to turn it off. The makers of the device are marketing it for high-level training, saying that even among professional athletes, the proportion who can score the top ranking of "light speed" is less than 22% . As a fitness trainer who wants to buy the device to attract more customers, you want to feel comfortable that the claim made by the makers is correct. To test the claim, you decide to perform a hypothesis test. To do so, you rent the device and have a random sample of 130 professional athletes use it; 26 score a ranking of "light speed." You confirm that it is appropriate to perform a Z -test. Why is a Z -test appropriate? Find z , the value of the test statistic for your Z -test. Round your answer to three or more decimal places. =zA recent drug survey showed an increase in the use of drugs and alcohol among local high school seniors as compared to the national percentage. Suppose that a survey of 100 local seniors and 100 national seniors is conducted to see if the proportion of drug and alcohol use is higher locally than nationally. Locally, 65 seniors reported using drugs or alcohol within the past month, while 60 national seniors reported using them. Conduct a hypothesis test at the 5% level.NOTE: If you are using a Student's t-distribution for the problem, including for paired data, you may assume that the underlying population is normally distributed. (In general, you must first prove that assumption, though.) Part (a) State the null hypothesis. H0: plocal ≠ pnational H0: plocal > pnational H0: plocal = pnational H0: plocal < pnational Part (b) State the alternative hypothesis. Ha: plocal < pnational Ha: plocal = pnational Ha: plocal ≠ pnational Ha: plocal > pnational…
- Historically, Olympic officials have reported testosterone levels, in general, should be µ = 538 ng/dL, with σ = 189, with x being normally distributed. Summer Olympic sprinters (n = 8) from the U.S. were tested for testosterone levels the morning after the opening ceremonies. Their sample mean was x̄=688 ng/dL. Do these data indicate that the sprinters had an overall average testosterone level greater than 538? Use α = .05. State α, Ho, H1, p-value, rejection, or non-rejection, and be certain to interpret your results.A recent drug survey showed an increase in the use of drugs and alcohol among local high school seniors as compared to the national percent. Suppose that a survey of 100 local seniors and 100 national seniors is conducted to see if the proportion of drug and alcohol use is higher locally than nationally. Locally, 67 seniors reported using drugs or alcohol within the past month, while 61 national seniors reported using them. Conduct a hypothesis test at the 5% level.NOTE: If you are using a Student's t-distribution for the problem, including for paired data, you may assume that the underlying population is normally distributed. (In general, you must first prove that assumption, though.) State the distribution to use for the test. (Round your answers to four decimal places.) P'local − P'national ~ ,A study of 200 randomly selected occupants in passenger cars and 250 randomly selected occupants in pickup trucks show that 182 of occupants in passenger cars and 208 of occupants in pickup trucks wear seat belts. At α=0.10, can you reject the claim that the proportion of occupants who wear seatbelts is the same for the passenger cars and pickup trucks?
- A greenhouse wants to test the effectiveness of alternative fertilizers on plant growth. One sample of 400 is treated with brand A & another 400 was treated with brand B. After 2 weeks results showed that 150 bloom from brand A and 130 bloom from brand B. What can it conclude at 0.05 level of significance that the 2 brands are not equally effective?. What is the computed value and decision?Many states have attempted to reduce the blood alcohol level at which a driver is declared to be legally drunk. There has been resistance to this change in the law by certain business groups who have argued that the current limit is adequate. A study was conducted to demonstrate the effect on the reaction time of a blood-alcohol level of .1%, the current limit in many states. A random sample of 25 persons of legal driving age had their reaction time recorded in a standard laboratory test procedure before and after drinking a sufficient amount of alcohol to raise their blood alcohol to a .1% level. The difference (After − Before) in their reaction times in seconds was recorded as follows: 0.01 0.02 0.04 0.05 0.07 0.09 0.11 0.26 0.27 0.27 0.28 0.28 0.29 0.29 0.30 0.31 0.31 0.32 0.33 0.35 0.36 0.38 0.39 0 .39 0.40 Graph the data and assess whether the population has a normal distribution. Is there…An independent research group is interested to show that the percentage of babies delivered through Cesarean Section is decreasing. Fof the past years, 20% of the babies were delivered through Cesarean Section. The research group randomly inspects the medical records of 144 births and finds that 25 of the births were by Cesarean Section. Can the research group conclude that the percent of births by Cesarean Section has decreased at 5% level of significance?