5. [Facebook An Internet survey asked 525 Facebook users whether the amount of time they spent using Facebook was increased over the past year. The response of the survey is "Increase", with values "Yes" and "No". Additionally, gender information was collected in the survey. The data is summarized in the following table. Gender X p= X/n Female 292 47 0.1610 Male 233 21 0.0901 Total 525 68 0.1295 In the table, the n column gives the sample size for each group, X column gives the number of users who increased their use of Facebook over the past year, and p column gives the sample proportion. (a) male who increased their time spent on Facebook over the past year. Keep the 4th decimal place in your numerical answer. Find the 95% confidence interval for the difference between the proportion of female and that of
5. [Facebook An Internet survey asked 525 Facebook users whether the amount of time they spent using Facebook was increased over the past year. The response of the survey is "Increase", with values "Yes" and "No". Additionally, gender information was collected in the survey. The data is summarized in the following table. Gender X p= X/n Female 292 47 0.1610 Male 233 21 0.0901 Total 525 68 0.1295 In the table, the n column gives the sample size for each group, X column gives the number of users who increased their use of Facebook over the past year, and p column gives the sample proportion. (a) male who increased their time spent on Facebook over the past year. Keep the 4th decimal place in your numerical answer. Find the 95% confidence interval for the difference between the proportion of female and that of

Glencoe Algebra 1, Student Edition, 9780079039897, 0079039898, 2018
18th Edition
ISBN:9780079039897
Author:Carter
Publisher:Carter
Chapter10: Statistics
Section10.6: Summarizing Categorical Data
Problem 30PPS

Related questions
Question
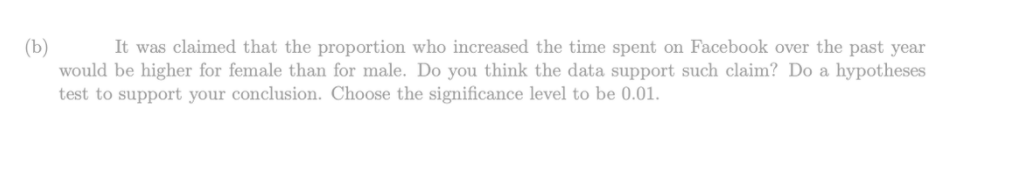
Transcribed Image Text:It was claimed that the proportion who increased the time spent on Facebook over the past year
(b)
would be higher for female than for male. Do you think the data support such claim? Do a hypotheses
test to support your conclusion. Choose the significance level to be 0.01.
Transcribed Image Text:5. [Facebookj
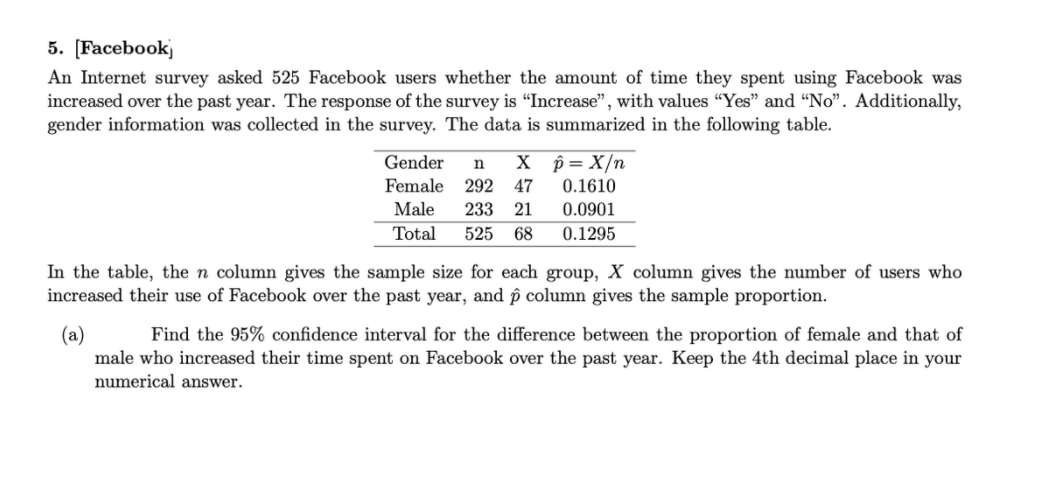
An Internet survey asked 525 Facebook users whether the amount of time they spent using Facebook was
increased over the past year. The response of the survey is "Increase", with values "Yes" and "No". Additionally,
gender information was collected in the survey. The data is summarized in the following table.
Gender
X p= X/n
n
Female 292 47
0.1610
Male
233 21
0.0901
Total
525
68
0.1295
In the table, the n column gives the sample size for each group, X column gives the number of users who
increased their use of Facebook over the past year, and p column gives the sample proportion.
(a)
male who increased their time spent on Facebook over the past year. Keep the 4th decimal place in your
numerical answer.
Find the 95% confidence interval for the difference between the proportion of female and that of
Expert Solution
This question has been solved!
Explore an expertly crafted, step-by-step solution for a thorough understanding of key concepts.

Step by step
Solved in 4 steps with 3 images

Recommended textbooks for you
Glencoe Algebra 1, Student Edition, 9780079039897…
Algebra
ISBN:
9780079039897
Author:
Carter
Publisher:
McGraw Hill

College Algebra (MindTap Course List)
Algebra
ISBN:
9781305652231
Author:
R. David Gustafson, Jeff Hughes
Publisher:
Cengage Learning
Glencoe Algebra 1, Student Edition, 9780079039897…
Algebra
ISBN:
9780079039897
Author:
Carter
Publisher:
McGraw Hill
College Algebra (MindTap Course List)
Algebra
ISBN:
9781305652231
Author:
R. David Gustafson, Jeff Hughes
Publisher:
Cengage Learning