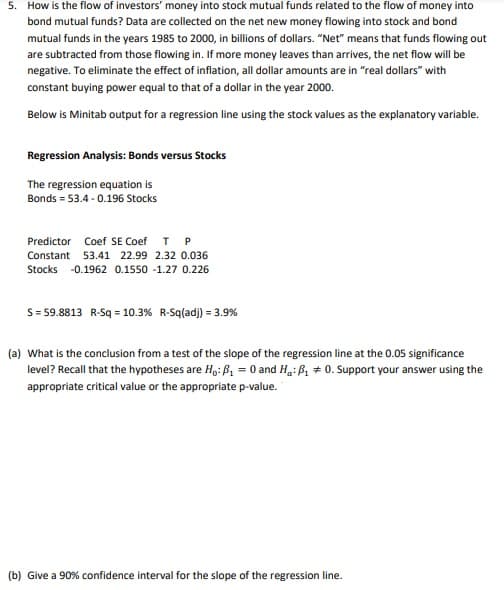
5. How is the flow of investors' money into stock mutual funds related to the flow of money into bond mutual funds? Data are collected on the net new money flowing into stock and bond mutual funds in the years 1985 to 2000, in billions of dollars. "Net" means that funds flowing out are subtracted from those flowing in. If more money leaves than arrives, the net flow will be negative. To eliminate the effect of inflation, all dollar amounts are in "real dollars" with constant buying power equal to that of a dollar in the year 2000. Below is Minitab output for a regression line using the stock values as the explanatory variable. Regression Analysis: Bonds versus Stocks The regression equation is Bonds = 53.4 - 0.196 Stocks Predictor Coef SE Coef T P Constant 53.41 22.99 2.32 0.036 Stocks -0.1962 0.1550 -1.27 0.226 S= 59.8813 R-Sq = 10.3% R-Sq(ad) = 3.9% (a) What is the conclusion from a test of the slope of the regression line at the 0.05 significance level? Recall that the hypotheses are H,: B, = 0 and Ha: B, # 0. Support your answer using the appropriate critical value or the appropriate p-value. (b) Give a 90% confidence interval for the slope of the regression line.
5. How is the flow of investors' money into stock mutual funds related to the flow of money into bond mutual funds? Data are collected on the net new money flowing into stock and bond mutual funds in the years 1985 to 2000, in billions of dollars. "Net" means that funds flowing out are subtracted from those flowing in. If more money leaves than arrives, the net flow will be negative. To eliminate the effect of inflation, all dollar amounts are in "real dollars" with constant buying power equal to that of a dollar in the year 2000. Below is Minitab output for a regression line using the stock values as the explanatory variable. Regression Analysis: Bonds versus Stocks The regression equation is Bonds = 53.4 - 0.196 Stocks Predictor Coef SE Coef T P Constant 53.41 22.99 2.32 0.036 Stocks -0.1962 0.1550 -1.27 0.226 S= 59.8813 R-Sq = 10.3% R-Sq(ad) = 3.9% (a) What is the conclusion from a test of the slope of the regression line at the 0.05 significance level? Recall that the hypotheses are H,: B, = 0 and Ha: B, # 0. Support your answer using the appropriate critical value or the appropriate p-value. (b) Give a 90% confidence interval for the slope of the regression line.

MATLAB: An Introduction with Applications
6th Edition
ISBN:9781119256830
Author:Amos Gilat
Publisher:Amos Gilat
Chapter1: Starting With Matlab
Section: Chapter Questions
Problem 1P

Related questions
Question
Transcribed Image Text:5. How is the flow of investors' money into stock mutual funds related to the flow of money into
bond mutual funds? Data are collected on the net new money flowing into stock and bond
mutual funds in the years 1985 to 2000, in billions of dollars. "Net" means that funds flowing out
are subtracted from those flowing in. If more money leaves than arrives, the net flow will be
negative. To eliminate the effect of inflation, all dollar amounts are in "real dollars" with
constant buying power equal to that of a dollar in the year 2000.
Below is Minitab output for a regression line using the stock values as the explanatory variable.
Regression Analysis: Bonds versus Stocks
The regression equation is
Bonds = 53.4 - 0.196 Stocks
Predictor Coef SE Coef
T P
Constant 53.41 22.99 2.32 0.036
Stocks
-0.1962 0.1550 -1.27 0.226
S= 59.8813 R-Sq = 10.3% R-Sq(adj) = 3.9%
(a) What is the conclusion from a test of the slope of the regression line at the 0.05 significance
level? Recall that the hypotheses are H,: B, = 0 and H.: ß, + 0. Support your answer using the
appropriate critical value or the appropriate p-value.
(b) Give a 90% confidence interval for the slope of the regression line.
Expert Solution
This question has been solved!
Explore an expertly crafted, step-by-step solution for a thorough understanding of key concepts.

This is a popular solution!

Trending now
This is a popular solution!

Step by step
Solved in 3 steps with 2 images

Knowledge Booster


Learn more about
Need a deep-dive on the concept behind this application? Look no further. Learn more about this topic, statistics and related others by exploring similar questions and additional content below.Recommended textbooks for you
MATLAB: An Introduction with Applications
Statistics
ISBN:
9781119256830
Author:
Amos Gilat
Publisher:
John Wiley & Sons Inc

Probability and Statistics for Engineering and th…
Statistics
ISBN:
9781305251809
Author:
Jay L. Devore
Publisher:
Cengage Learning

Statistics for The Behavioral Sciences (MindTap C…
Statistics
ISBN:
9781305504912
Author:
Frederick J Gravetter, Larry B. Wallnau
Publisher:
Cengage Learning
MATLAB: An Introduction with Applications
Statistics
ISBN:
9781119256830
Author:
Amos Gilat
Publisher:
John Wiley & Sons Inc
Probability and Statistics for Engineering and th…
Statistics
ISBN:
9781305251809
Author:
Jay L. Devore
Publisher:
Cengage Learning
Statistics for The Behavioral Sciences (MindTap C…
Statistics
ISBN:
9781305504912
Author:
Frederick J Gravetter, Larry B. Wallnau
Publisher:
Cengage Learning

Elementary Statistics: Picturing the World (7th E…
Statistics
ISBN:
9780134683416
Author:
Ron Larson, Betsy Farber
Publisher:
PEARSON

The Basic Practice of Statistics
Statistics
ISBN:
9781319042578
Author:
David S. Moore, William I. Notz, Michael A. Fligner
Publisher:
W. H. Freeman

Introduction to the Practice of Statistics
Statistics
ISBN:
9781319013387
Author:
David S. Moore, George P. McCabe, Bruce A. Craig
Publisher:
W. H. Freeman