5. Random samples of seven students from each of three dormitories were asked to rate on a scale of 1 (poor) to 10 (excellent) quality of the social life in their own dormitory. The ratings are shown below in the table: Dormito Dormito Dormito гy А ry B гу С 8 7 6 7 5 9. 9 7 9. 10 4 10 3 10 8 2 7 7 5.1. Construct an ANOVA Table 5.2. Test whether the population mean ratings are the same for all three dormitories. Use 5% significance level.
5. Random samples of seven students from each of three dormitories were asked to rate on a scale of 1 (poor) to 10 (excellent) quality of the social life in their own dormitory. The ratings are shown below in the table: Dormito Dormito Dormito гy А ry B гу С 8 7 6 7 5 9. 9 7 9. 10 4 10 3 10 8 2 7 7 5.1. Construct an ANOVA Table 5.2. Test whether the population mean ratings are the same for all three dormitories. Use 5% significance level.

College Algebra (MindTap Course List)
12th Edition
ISBN:9781305652231
Author:R. David Gustafson, Jeff Hughes
Publisher:R. David Gustafson, Jeff Hughes
Chapter8: Sequences, Series, And Probability
Section8.7: Probability
Problem 6E: List the sample space of each experiment. Tossing three coins

Related questions
Question
100%
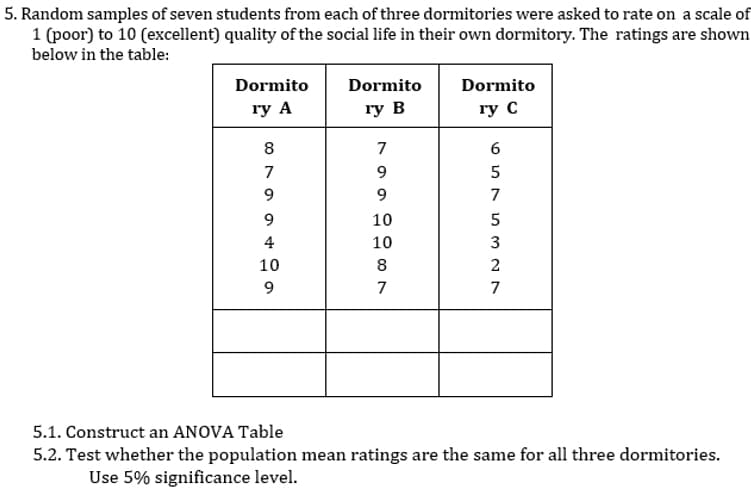
Transcribed Image Text:5. Random samples of seven students from each of three dormitories were asked to rate on a scale of
1 (poor) to 10 (excellent) quality of the social life in their own dormitory. The ratings are shown
below in the table:
Dormito
Dormito
Dormito
гy А
гу В
гу С
8
7
7
9
7
10
4
10
3
10
8
9.
7
7
5.1. Construct an ANOVA Table
5.2. Test whether the population mean ratings are the same for all three dormitories.
Use 5% significance level.
Expert Solution
This question has been solved!
Explore an expertly crafted, step-by-step solution for a thorough understanding of key concepts.

Step by step
Solved in 3 steps

Recommended textbooks for you
College Algebra (MindTap Course List)
Algebra
ISBN:
9781305652231
Author:
R. David Gustafson, Jeff Hughes
Publisher:
Cengage Learning
College Algebra (MindTap Course List)
Algebra
ISBN:
9781305652231
Author:
R. David Gustafson, Jeff Hughes
Publisher:
Cengage Learning