5. The average annual miles driven per vehicle in the United States is 11.1 thousand miles, with a 600 miles. Suppose that a random sample of 26 vehicles owned by residents of Chicago showed that the average mileage driven last year was 10.8 thousand miles. Does this indicate that 6. the average miles driven per vehicle in Chicago is different from (higher or lower than) the national average? Use a 0.05 level of significance. What are we testing in this problem? 1) single proportion ii) single mean (a) What is the level of significance? State the null and alternate hypotheses.
5. The average annual miles driven per vehicle in the United States is 11.1 thousand miles, with a 600 miles. Suppose that a random sample of 26 vehicles owned by residents of Chicago showed that the average mileage driven last year was 10.8 thousand miles. Does this indicate that 6. the average miles driven per vehicle in Chicago is different from (higher or lower than) the national average? Use a 0.05 level of significance. What are we testing in this problem? 1) single proportion ii) single mean (a) What is the level of significance? State the null and alternate hypotheses.

Glencoe Algebra 1, Student Edition, 9780079039897, 0079039898, 2018
18th Edition
ISBN:9780079039897
Author:Carter
Publisher:Carter
Chapter10: Statistics
Section10.3: Measures Of Spread
Problem 26PFA

Related questions
Question
Help
With 5
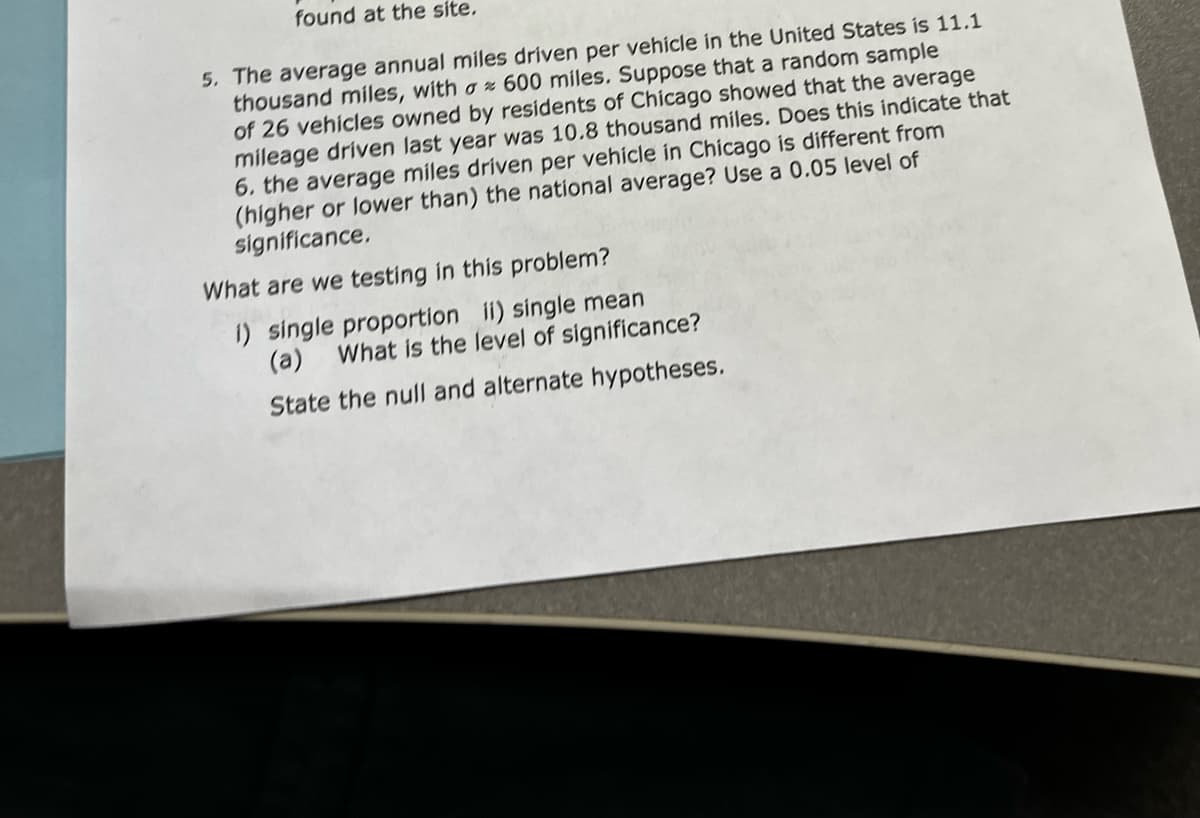
Transcribed Image Text:found at the site.
5. The average annual miles driven per vehicle in the United States is 11.1
thousand miles, with a x 600 miles. Suppose that a random sample
of 26 vehicles owned by residents of Chicago showed that the average
mileage driven last year was 10.8 thousand miles. Does this indicate that
6, the average miles driven per vehicle in Chicago is different from
(higher or lower than) the national average? Use a 0.05 level of
significance.
What are we testing in this problem?
1) single proportion ii) single mean
(a)
What is the level of significance?
State the null and alternate hypotheses.
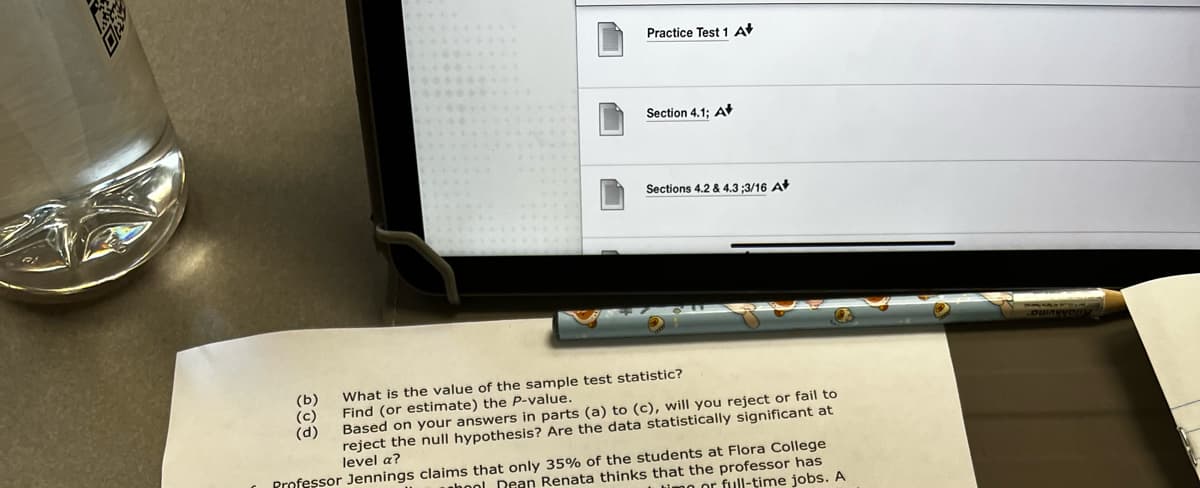
Transcribed Image Text:Practice Test 1 A
Section 4.1; A
Sections 4.2 & 4.3 ;3/16 A
(b)
(с)
(d)
What is the value of the sample test statistic?
Find (or estimate) the P-value.
Based on your answers in parts (a) to (c), will you reject or fail to
reject the null hypothesis? Are the data statistically significant at
level a?
Professor Jennings claims that only 35% of the students at Flora College
nhool Dean Renata thinks that the professor has
imo or full-time jobs. A
Expert Solution
This question has been solved!
Explore an expertly crafted, step-by-step solution for a thorough understanding of key concepts.

This is a popular solution!

Trending now
This is a popular solution!

Step by step
Solved in 4 steps with 1 images

Recommended textbooks for you
Glencoe Algebra 1, Student Edition, 9780079039897…
Algebra
ISBN:
9780079039897
Author:
Carter
Publisher:
McGraw Hill
Glencoe Algebra 1, Student Edition, 9780079039897…
Algebra
ISBN:
9780079039897
Author:
Carter
Publisher:
McGraw Hill