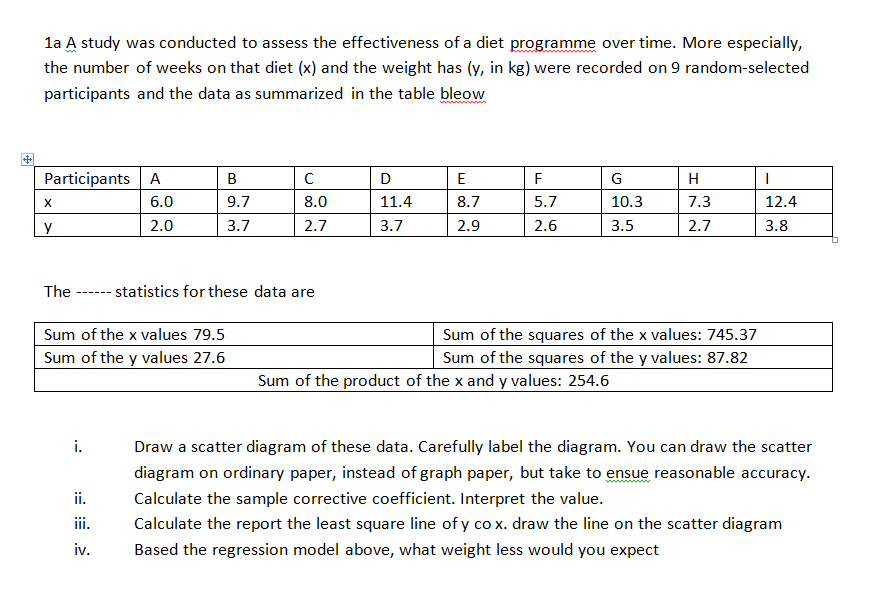
la A study was conducted to assess the effectiveness of a diet programme over time. More especially, the number of weeks on that diet (x) and the weight has (y, in kg) were recorded on 9 random-selected participants and the data as summarized in the table bleow Participants A B E F G H X 6.0 9.7 8.0 11.4 8.7 5.7 10.3 7.3 12.4 2.0 3.7 2.7 3.7 2.9 2.6 3.5 2.7 3.8 The ------ statistics for these data are Sum of the x values 79.5 Sum of the squares of the x values: 745.37 Sum of the y values 27.6 Sum of the squares of the y values: 87.82 Sum of the product of the x and y values: 254.6 i. Draw a scatter diagram of these data. Carefully label the diagram. You can draw the scatter diagram on ordinary paper, instead of graph paper, but take to ensue reasonable accuracy. ii. Calculate the sample corrective coefficient. Interpret the value. iii. Calculate the report the least square line of y co x. draw the line on the scatter diagram
la A study was conducted to assess the effectiveness of a diet programme over time. More especially, the number of weeks on that diet (x) and the weight has (y, in kg) were recorded on 9 random-selected participants and the data as summarized in the table bleow Participants A B E F G H X 6.0 9.7 8.0 11.4 8.7 5.7 10.3 7.3 12.4 2.0 3.7 2.7 3.7 2.9 2.6 3.5 2.7 3.8 The ------ statistics for these data are Sum of the x values 79.5 Sum of the squares of the x values: 745.37 Sum of the y values 27.6 Sum of the squares of the y values: 87.82 Sum of the product of the x and y values: 254.6 i. Draw a scatter diagram of these data. Carefully label the diagram. You can draw the scatter diagram on ordinary paper, instead of graph paper, but take to ensue reasonable accuracy. ii. Calculate the sample corrective coefficient. Interpret the value. iii. Calculate the report the least square line of y co x. draw the line on the scatter diagram

Holt Mcdougal Larson Pre-algebra: Student Edition 2012
1st Edition
ISBN:9780547587776
Author:HOLT MCDOUGAL
Publisher:HOLT MCDOUGAL
Chapter11: Data Analysis And Probability
Section: Chapter Questions
Problem 8CR

Related questions
Question
please help
Transcribed Image Text:la A study was conducted to assess the effectiveness of a diet programme over time. More especially,
the number of weeks on that diet (x) and the weight has (y, in kg) were recorded on 9 random-selected
participants and the data as summarized in the table bleow
Participants A
B
E
F
G
H
6.0
9.7
8.0
11.4
8.7
5.7
10.3
7.3
12.4
y
2.0
3.7
2.7
3.7
2.9
2.6
3.5
2.7
3.8
The ----- statistics for these data are
Sum of the x values 79.5
Sum of the squares of the x values: 745.37
Sum of the y values 27.6
Sum of the squares of the y values: 87.82
Sum of the product of the x and y values: 254.6
i.
Draw a scatter diagram of these data. Carefully label the diagram. You can draw the scatter
diagram on ordinary paper, instead of graph paper, but take to ensue reasonable accuracy.
ii.
Calculate the sample corrective coefficient. Interpret the value.
iii.
Calculate the report the least square line of y co x. draw the line on the scatter diagram
iv.
Based the regression model above, what weight less would you expect
Expert Solution
This question has been solved!
Explore an expertly crafted, step-by-step solution for a thorough understanding of key concepts.

Step by step
Solved in 4 steps with 11 images

Recommended textbooks for you
Holt Mcdougal Larson Pre-algebra: Student Edition…
Algebra
ISBN:
9780547587776
Author:
HOLT MCDOUGAL
Publisher:
HOLT MCDOUGAL

College Algebra (MindTap Course List)
Algebra
ISBN:
9781305652231
Author:
R. David Gustafson, Jeff Hughes
Publisher:
Cengage Learning
Holt Mcdougal Larson Pre-algebra: Student Edition…
Algebra
ISBN:
9780547587776
Author:
HOLT MCDOUGAL
Publisher:
HOLT MCDOUGAL
College Algebra (MindTap Course List)
Algebra
ISBN:
9781305652231
Author:
R. David Gustafson, Jeff Hughes
Publisher:
Cengage Learning