5. The grades of a class of 17 randomly selected students taking a course in Statistics and a course in English are given in the following table. Assume that the grades are jointly normally distributed. Statistics, y 80 81 75 81 92 95 | 80 81 85 72 65 93 81 70 73 12 80 English, x86 75 69 75 90 94 83 86 84 71 62 90 83 75 71 76 84 (a) Compute and interpret; (i) the Pearson correlation coefficient (ii) the Spearman Rank Correlation coefficient (iii) What can you say about your results in (i) and (ii) above (b) Using a graph sheet with the appropriate scale, construct a scatter plot for the data (c) Find the least squares regression line relating Statistics final grades to English final grades (d) Construct the analysis of variance (ANOVA) table for testing the significance of the fitted line in (c) above (e) Determine and interpret the coefficient of determination of the model
5. The grades of a class of 17 randomly selected students taking a course in Statistics and a course in English are given in the following table. Assume that the grades are jointly normally distributed. Statistics, y 80 81 75 81 92 95 | 80 81 85 72 65 93 81 70 73 12 80 English, x86 75 69 75 90 94 83 86 84 71 62 90 83 75 71 76 84 (a) Compute and interpret; (i) the Pearson correlation coefficient (ii) the Spearman Rank Correlation coefficient (iii) What can you say about your results in (i) and (ii) above (b) Using a graph sheet with the appropriate scale, construct a scatter plot for the data (c) Find the least squares regression line relating Statistics final grades to English final grades (d) Construct the analysis of variance (ANOVA) table for testing the significance of the fitted line in (c) above (e) Determine and interpret the coefficient of determination of the model

Glencoe Algebra 1, Student Edition, 9780079039897, 0079039898, 2018
18th Edition
ISBN:9780079039897
Author:Carter
Publisher:Carter
Chapter10: Statistics
Section10.4: Distributions Of Data
Problem 19PFA

Related questions
Question
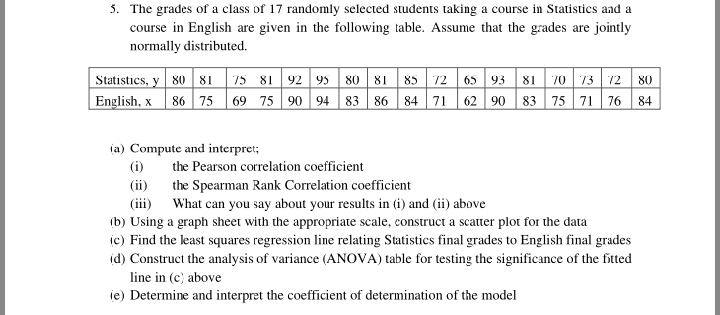
Transcribed Image Text:5. The grades of a class of 17 randomly selected students taking a course in Statistics and a
course in English are given in the following table. Assume that the grades are jointly
normally distributed.
Statistics, y 80 81 75 81 92 95 | 80 81 85 72 65 93 81 70 73 12 80
English, x86 75 69 75 90 94 83 86 84 71 62 90 83 75 71 76 84
(a) Compute and interpret;
(i)
the Pearson correlation coefficient
(ii) the Spearman Rank Correlation coefficient
(iii) What can you say about your results in (i) and (ii) above
(b) Using a graph sheet with the appropriate scale, construct a scatter plot for the data
(c) Find the least squares regression line relating Statistics final grades to English final grades
(d) Construct the analysis of variance (ANOVA) table for testing the significance of the fitted
line in (c) above
(e) Determine and interpret the coefficient of determination of the model
Expert Solution
This question has been solved!
Explore an expertly crafted, step-by-step solution for a thorough understanding of key concepts.

Step by step
Solved in 4 steps with 4 images

Knowledge Booster


Learn more about
Need a deep-dive on the concept behind this application? Look no further. Learn more about this topic, statistics and related others by exploring similar questions and additional content below.Recommended textbooks for you
Glencoe Algebra 1, Student Edition, 9780079039897…
Algebra
ISBN:
9780079039897
Author:
Carter
Publisher:
McGraw Hill
Glencoe Algebra 1, Student Edition, 9780079039897…
Algebra
ISBN:
9780079039897
Author:
Carter
Publisher:
McGraw Hill