5. Two thousand randomly selected adults were asked if they think they are financially better off than their parents. The following table gives the classification of the responses based on the education levels of the persons included in the survey whether they are better off, the same, or worse of financially than their parents. Suppose one adult is selected at random from these 2000 adults, Education Level Less Than High School More Than Total High School High School Better Off 140 420 Same 60 110 420 Worse Off 570 Total 400 1000 600 2000 (i) Complete the missing values (ii) What is the probability that the selected adult is financially better off than his/her parents or has high school education? (iii)What is the probability that the selected adult is not financially worse off than his/her parents given that he/she has not high school education?
5. Two thousand randomly selected adults were asked if they think they are financially better off than their parents. The following table gives the classification of the responses based on the education levels of the persons included in the survey whether they are better off, the same, or worse of financially than their parents. Suppose one adult is selected at random from these 2000 adults, Education Level Less Than High School More Than Total High School High School Better Off 140 420 Same 60 110 420 Worse Off 570 Total 400 1000 600 2000 (i) Complete the missing values (ii) What is the probability that the selected adult is financially better off than his/her parents or has high school education? (iii)What is the probability that the selected adult is not financially worse off than his/her parents given that he/she has not high school education?

Holt Mcdougal Larson Pre-algebra: Student Edition 2012
1st Edition
ISBN:9780547587776
Author:HOLT MCDOUGAL
Publisher:HOLT MCDOUGAL
Chapter11: Data Analysis And Probability
Section11.5: Interpreting Data
Problem 1C

Related questions
Question
Explain with steps
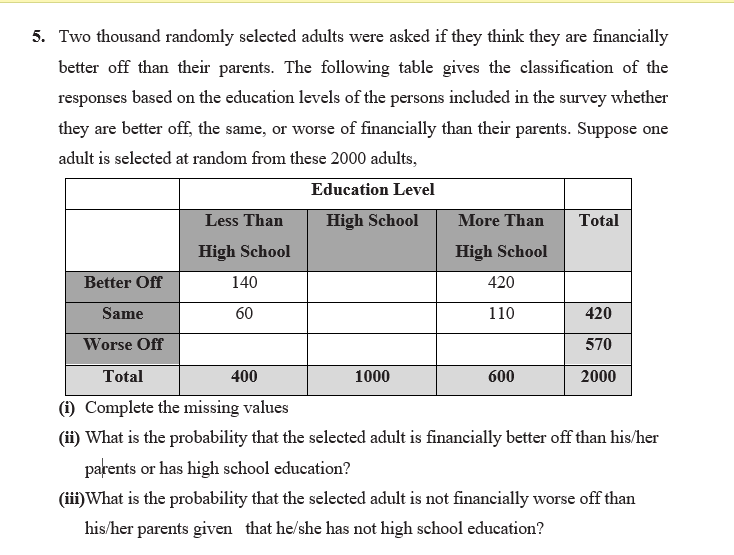
Transcribed Image Text:5. Two thousand randomly selected adults were asked if they think they are financially
better off than their parents. The following table gives the classification of the
responses based on the education levels of the persons included in the survey whether
they are better off, the same, or worse of financially than their parents. Suppose one
adult is selected at random from these 2000 adults,
Education Level
Less Than
High School
More Than
Total
High School
High School
Better Off
140
420
Same
60
110
420
Worse Off
570
Total
400
1000
600
2000
(i) Complete the missing values
(ii) What is the probability that the selected adult is financially better off than his/her
parents or has high school education?
(ii)What is the probability that the selected adult is not financially worse off than
his/her parents given that he/she has not high school education?
Expert Solution
This question has been solved!
Explore an expertly crafted, step-by-step solution for a thorough understanding of key concepts.

This is a popular solution!

Trending now
This is a popular solution!

Step by step
Solved in 4 steps

Recommended textbooks for you
Holt Mcdougal Larson Pre-algebra: Student Edition…
Algebra
ISBN:
9780547587776
Author:
HOLT MCDOUGAL
Publisher:
HOLT MCDOUGAL
Holt Mcdougal Larson Pre-algebra: Student Edition…
Algebra
ISBN:
9780547587776
Author:
HOLT MCDOUGAL
Publisher:
HOLT MCDOUGAL