A random sample of n, = 16 communities in western Kansas gave the following information for people under 25 years of age. x,: Rate of hay fever per 1000 population for people under 25 100 90 121 129 94 123 112 93 125 95 125 117 97 122 127 88 A random sample of n, = 14 regions in western Kansas gave the following information for people over 50 years old. x,: Rate of hay fever per 1000 population for people over 50 96 108 99 97 113 88 110 79 115 100 89 114 85 96 (i) Use a calculator to calculate x,, s,, X, and s,. (Round your answers to two decimal places.) X = S1 = X2 = S2 = (ii) Assume that the hay fever rate in each age group has an approximately normal distribution. Do the data indicate that the age group over 50 has a lower rate of hay fever? Use a = 0.05. (a) What is the level of significance?
A random sample of n, = 16 communities in western Kansas gave the following information for people under 25 years of age. x,: Rate of hay fever per 1000 population for people under 25 100 90 121 129 94 123 112 93 125 95 125 117 97 122 127 88 A random sample of n, = 14 regions in western Kansas gave the following information for people over 50 years old. x,: Rate of hay fever per 1000 population for people over 50 96 108 99 97 113 88 110 79 115 100 89 114 85 96 (i) Use a calculator to calculate x,, s,, X, and s,. (Round your answers to two decimal places.) X = S1 = X2 = S2 = (ii) Assume that the hay fever rate in each age group has an approximately normal distribution. Do the data indicate that the age group over 50 has a lower rate of hay fever? Use a = 0.05. (a) What is the level of significance?

Holt Mcdougal Larson Pre-algebra: Student Edition 2012
1st Edition
ISBN:9780547587776
Author:HOLT MCDOUGAL
Publisher:HOLT MCDOUGAL
Chapter11: Data Analysis And Probability
Section: Chapter Questions
Problem 8CR

Related questions

Topic Video
Question
Hi could you answer whats blank?
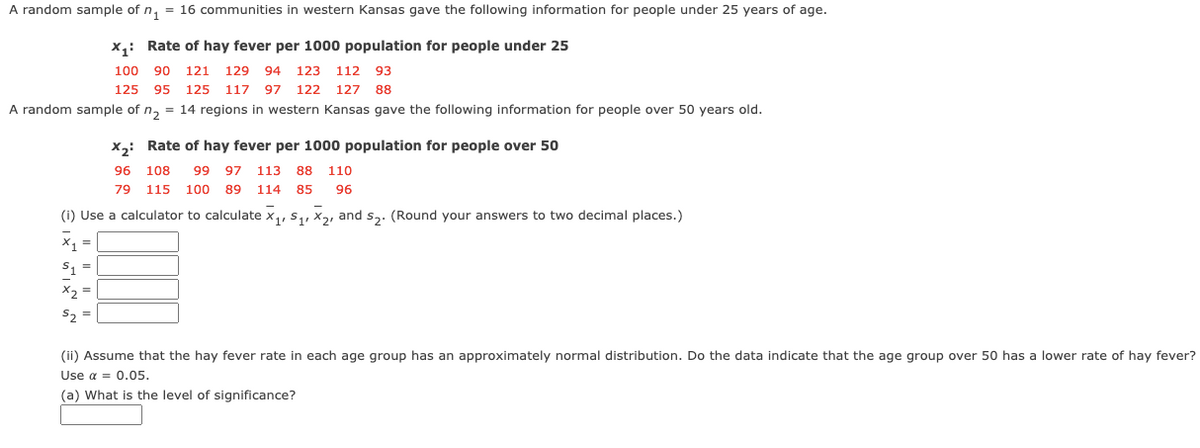
Transcribed Image Text:A random sample of n, = 16 communities in western Kansas gave the following information for people under 25 years of age.
x,: Rate of hay fever per 1000 population for people under 25
100 90 121
129 94
123
112 93
125 95
125 117 97 122
127 88
A random sample of n, = 14 regions in western Kansas gave the following information for people over 50 years old.
x,: Rate of hay fever per 1000 population for people over 50
96
108
99 97
113
88 110
79
115
100
89
114
85
96
(i) Use a calculator to calculate x,, s,, X2, and s3. (Round your answers to two decimal places.)
x =
S1 =
X, =
S, =
(ii) Assume that the hay fever rate in each age group has an approximately normal distribution. Do the data indicate that the age group over 50 has a lower rate of hay fever?
Use a = 0.05.
(a) What is the level of significance?
Expert Solution
This question has been solved!
Explore an expertly crafted, step-by-step solution for a thorough understanding of key concepts.

Step by step
Solved in 2 steps

Knowledge Booster


Learn more about
Need a deep-dive on the concept behind this application? Look no further. Learn more about this topic, statistics and related others by exploring similar questions and additional content below.Recommended textbooks for you
Holt Mcdougal Larson Pre-algebra: Student Edition…
Algebra
ISBN:
9780547587776
Author:
HOLT MCDOUGAL
Publisher:
HOLT MCDOUGAL

Algebra & Trigonometry with Analytic Geometry
Algebra
ISBN:
9781133382119
Author:
Swokowski
Publisher:
Cengage
Holt Mcdougal Larson Pre-algebra: Student Edition…
Algebra
ISBN:
9780547587776
Author:
HOLT MCDOUGAL
Publisher:
HOLT MCDOUGAL
Algebra & Trigonometry with Analytic Geometry
Algebra
ISBN:
9781133382119
Author:
Swokowski
Publisher:
Cengage