5. What percentage of the children watched TV between 20 and 30 hours per week? 6. The Mode is the most frequently occurring score. What is the Mode in Figure 1?
5. What percentage of the children watched TV between 20 and 30 hours per week? 6. The Mode is the most frequently occurring score. What is the Mode in Figure 1?

Big Ideas Math A Bridge To Success Algebra 1: Student Edition 2015
1st Edition
ISBN:9781680331141
Author:HOUGHTON MIFFLIN HARCOURT
Publisher:HOUGHTON MIFFLIN HARCOURT
Chapter11: Data Analysis And Displays
Section11.1: Measures Of Center And Variation
Problem 39E

Related questions
Question
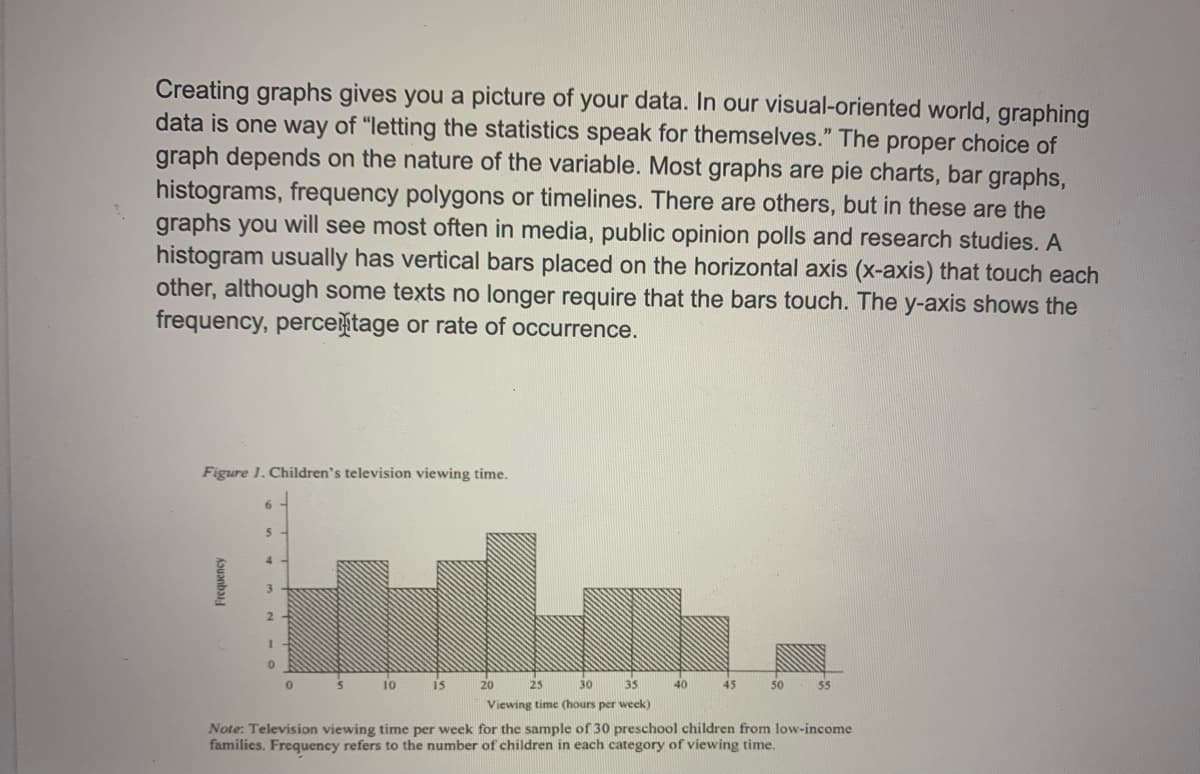
Transcribed Image Text:Creating graphs gives you a picture of your data. In our visual-oriented world, graphing
data is one way of "letting the statistics speak for themselves." The proper choice of
graph depends on the nature of the variable. Most graphs are pie charts, bar graphs,
histograms, frequency polygons or timelines. There are others, but in these are the
graphs you will see most often in media, public opinion polls and research studies. A
histogram usually has vertical bars placed on the horizontal axis (x-axis) that touch each
other, although some texts no longer require that the bars touch. The y-axis shows the
frequency, percetage or rate of occurrence.
Figure 1. Children's television viewing time.
6.
2.
10
15
20
25
30
35
40
45
50
Viewing time (hours per week)
Note: Television viewing time per week for the sample of 30 preschool children from low-income
families. Frequency refers to the number of children in each category of viewing time.
Transcribed Image Text:5. What percentage of the children watched TV between 20 and 30 hours per week?
6. The Mode is the most frequently occurring score. What is the Mode in Figure 1?
Expert Solution
This question has been solved!
Explore an expertly crafted, step-by-step solution for a thorough understanding of key concepts.

This is a popular solution!

Trending now
This is a popular solution!

Step by step
Solved in 5 steps

Recommended textbooks for you
Big Ideas Math A Bridge To Success Algebra 1: Stu…
Algebra
ISBN:
9781680331141
Author:
HOUGHTON MIFFLIN HARCOURT
Publisher:
Houghton Mifflin Harcourt

Glencoe Algebra 1, Student Edition, 9780079039897…
Algebra
ISBN:
9780079039897
Author:
Carter
Publisher:
McGraw Hill

Holt Mcdougal Larson Pre-algebra: Student Edition…
Algebra
ISBN:
9780547587776
Author:
HOLT MCDOUGAL
Publisher:
HOLT MCDOUGAL
Big Ideas Math A Bridge To Success Algebra 1: Stu…
Algebra
ISBN:
9781680331141
Author:
HOUGHTON MIFFLIN HARCOURT
Publisher:
Houghton Mifflin Harcourt
Glencoe Algebra 1, Student Edition, 9780079039897…
Algebra
ISBN:
9780079039897
Author:
Carter
Publisher:
McGraw Hill
Holt Mcdougal Larson Pre-algebra: Student Edition…
Algebra
ISBN:
9780547587776
Author:
HOLT MCDOUGAL
Publisher:
HOLT MCDOUGAL