
Algebra & Trigonometry with Analytic Geometry
13th Edition
ISBN:9781133382119
Author:Swokowski
Publisher:Swokowski
Chapter7: Analytic Trigonometry
Section7.6: The Inverse Trigonometric Functions
Problem 91E

Related questions

Topic Video
Question
i need answers to each part please and thank you!
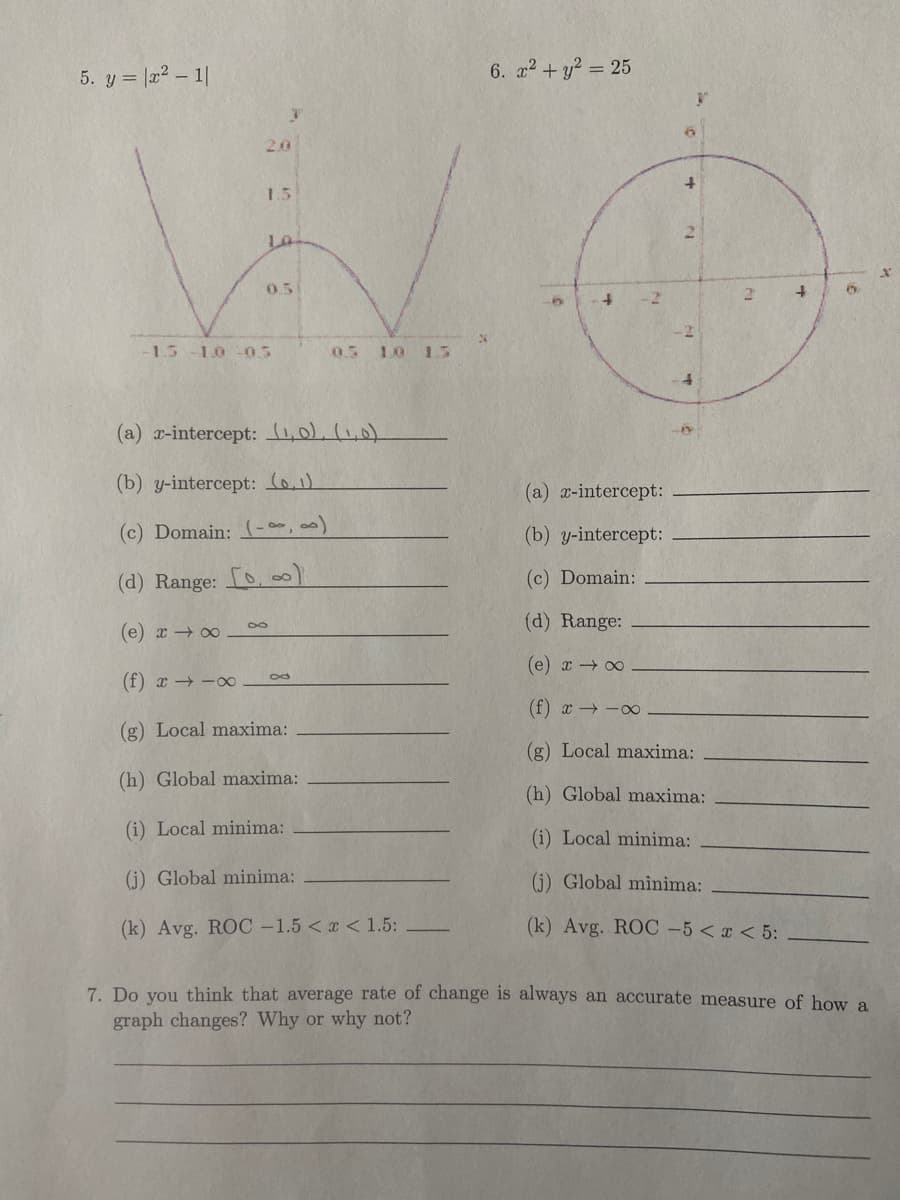
Transcribed Image Text:5. y = |22 – 1|
6. 22 + y? = 25
20
1.5
La
0.5
1.5-10 0.5
0.5 10 15
(a) x-intercept: 0.1,0)
(b) y-intercept: Co)
(a) a-intercept:
(c) Domain:
- , o)
(b) y-intercept:
(d) Range:
(c) Domain:
(d) Range:
(e) x → 00
(e) x 0
(f) x -00
(f) x -∞
(g) Local maxima:
(g) Local maxima:
(h) Global maxima:
(h) Global maxima:
(i) Local minima:
(i) Local minima:
(i) Global minima:
(i) Global minima:
(k) Avg. ROC –1.5 < x < 1.5:
(k) Avg. ROC -5 < x < 5:
7. Do vou think that average rate of change is always an accurate measure of how a
graph changes? Why or why not?
Expert Solution
This question has been solved!
Explore an expertly crafted, step-by-step solution for a thorough understanding of key concepts.

Step by step
Solved in 2 steps

Knowledge Booster


Learn more about
Need a deep-dive on the concept behind this application? Look no further. Learn more about this topic, calculus and related others by exploring similar questions and additional content below.Recommended textbooks for you
Algebra & Trigonometry with Analytic Geometry
Algebra
ISBN:
9781133382119
Author:
Swokowski
Publisher:
Cengage
Algebra & Trigonometry with Analytic Geometry
Algebra
ISBN:
9781133382119
Author:
Swokowski
Publisher:
Cengage