5.3 Plot the following functions on the same graph for x values from -T to T, selecting spacing to create a smooth plot: sin(x) sin(2a) Y1 Y2 Y3 sin(3x) (Hint: Recall that the appropriate MATLAB® syntax for 2x is 2* x.) 5.4 Adjust the plot created in Problem 5.3 Oso that: Line 1 is red and dashed. • Line 2 is blue and solid. · Line 3 is green and dotted. - Do not include markers on any of the graphs. In general, markers are included only on plots of measured data, not for calculated values. 5.5 Adjust the plot created in Problem 5.4 Oso that the x-axis goes from -6 to +6. · Add a legend. · Add a text box describing the plots.
5.3 Plot the following functions on the same graph for x values from -T to T, selecting spacing to create a smooth plot: sin(x) sin(2a) Y1 Y2 Y3 sin(3x) (Hint: Recall that the appropriate MATLAB® syntax for 2x is 2* x.) 5.4 Adjust the plot created in Problem 5.3 Oso that: Line 1 is red and dashed. • Line 2 is blue and solid. · Line 3 is green and dotted. - Do not include markers on any of the graphs. In general, markers are included only on plots of measured data, not for calculated values. 5.5 Adjust the plot created in Problem 5.4 Oso that the x-axis goes from -6 to +6. · Add a legend. · Add a text box describing the plots.

Computer Networking: A Top-Down Approach (7th Edition)
7th Edition
ISBN:9780133594140
Author:James Kurose, Keith Ross
Publisher:James Kurose, Keith Ross
Chapter1: Computer Networks And The Internet
Section: Chapter Questions
Problem R1RQ: What is the difference between a host and an end system? List several different types of end...

Related questions
Question
100%
Hi this is a Matlab problem, I need help on part 5.5, thank you!
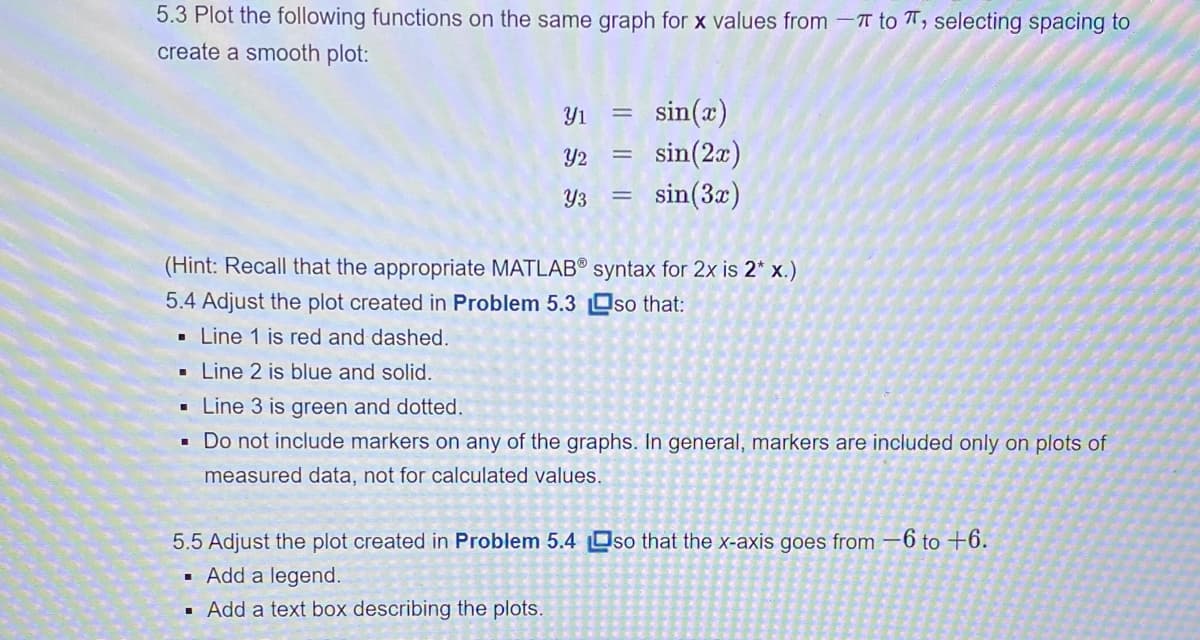
Transcribed Image Text:5.3 Plot the following functions on the same graph for x values from -T to T, selecting spacing to
create a smooth plot:
sin(x)
sin(2a)
sin(3æ)
Y1
Y2
Y3
(Hint: Recall that the appropriate MATLAB® syntax for 2x is 2* x.)
5.4 Adjust the plot created in Problem 5.3 Oso that:
Line 1 is red and dashed.
Line 2 is blue and solid.
Line 3 is green and dotted.
• Do not include markers on any of the graphs. In general, markers are included only on plots of
measured data, not for calculated values.
5.5 Adjust the plot created in Problem 5.4 Oso that the x-axis goes from –6 to +6.
· Add a legend.
Add a text box describing the plots.
Expert Solution
This question has been solved!
Explore an expertly crafted, step-by-step solution for a thorough understanding of key concepts.

This is a popular solution!

Trending now
This is a popular solution!

Step by step
Solved in 2 steps with 2 images

Recommended textbooks for you
Computer Networking: A Top-Down Approach (7th Edi…
Computer Engineering
ISBN:
9780133594140
Author:
James Kurose, Keith Ross
Publisher:
PEARSON

Computer Organization and Design MIPS Edition, Fi…
Computer Engineering
ISBN:
9780124077263
Author:
David A. Patterson, John L. Hennessy
Publisher:
Elsevier Science

Network+ Guide to Networks (MindTap Course List)
Computer Engineering
ISBN:
9781337569330
Author:
Jill West, Tamara Dean, Jean Andrews
Publisher:
Cengage Learning
Computer Networking: A Top-Down Approach (7th Edi…
Computer Engineering
ISBN:
9780133594140
Author:
James Kurose, Keith Ross
Publisher:
PEARSON
Computer Organization and Design MIPS Edition, Fi…
Computer Engineering
ISBN:
9780124077263
Author:
David A. Patterson, John L. Hennessy
Publisher:
Elsevier Science
Network+ Guide to Networks (MindTap Course List)
Computer Engineering
ISBN:
9781337569330
Author:
Jill West, Tamara Dean, Jean Andrews
Publisher:
Cengage Learning

Concepts of Database Management
Computer Engineering
ISBN:
9781337093422
Author:
Joy L. Starks, Philip J. Pratt, Mary Z. Last
Publisher:
Cengage Learning

Prelude to Programming
Computer Engineering
ISBN:
9780133750423
Author:
VENIT, Stewart
Publisher:
Pearson Education

Sc Business Data Communications and Networking, T…
Computer Engineering
ISBN:
9781119368830
Author:
FITZGERALD
Publisher:
WILEY