5.9 Classify the following soils using the Unified soil classification system. Give the group symbols and the group names. Sieve analysis– Percent finer Soil No. 4 No. 200 Liquid limit Plasticity index c, C. 1 70 30 33 21 48 20 41 22 3 95 70 52 28 4 100 82 30 19 5 100 74 35 21 6. 87 26 38 18 88 78 69 38 8 99 57 54 26 71 11 32 16 4.8 2.9 10 100 2 NP 7.2 2.2 11 89 65 44 21 12 90 8 39 31 3.9 2.1
Q: The sieve analysis of six soils and the liquid and plastic limits of the fraction passing through…
A: As per our guidelines, we are supposed to solve for the first three sub-parts, kindly submit others…
Q: 3.1 The results of particle size analyses and, where appropriate, limit tests on samples of four…
A: “Since you have asked multiple question, we will solve the first question for you. If you want any…
Q: For the sieve analysis test, the following data is obtained. Draw the grain size distribution curve…
A: Plot the grain size distribution curve.
Q: SITUATION 4: The following data shows the results of the sieve analysis of two soil samples A and B.…
A: 11. The uniformity coefficient is given by: Cu=D60D10 Where, D60 = Size at 60% finer by weight ≈2.38…
Q: The results from a soil compaction test are shown in the table below. The solid grains of the soil…
A:
Q: Q3: Classify the following soil according to USCS. PI=25, L.L.= 40 Sieve No. Mass of soil retained…
A: USCS: The full form of USCS is the Unified Soil Classification System. The unified soil…
Q: 2.6 The laboratory test results of six soils are given in the following table. Classify the soils by…
A: Given:- The laboratory test results of six soil are given To determine:- Classify the soils by the…
Q: are given in Figure 1 for Soils A and B. Answer the following questions: the uniformity coefficient,…
A:
Q: Sample Problem 2 The sieve analysis of three soils and the liquid and plastic limits of the fraction…
A: The given data is shown below:
Q: The sieve analysis, and the liquid and plastic limits of the four soils are given below. Using the…
A:
Q: For a given soil, the following are given in Table: Specific Gravity Gs. bulk unit weight (Y), and…
A: Dry unit weight is a measure of the number of solid particles per unit volume. Void ratio is defined…
Q: 19. The following results were obtained from sieve analyses of two soils: Sieve no. Soil A Opening…
A: “Since you have posted a question with multiple sub-parts, we will solve first three sub-parts for…
Q: 2.11 The following results were obtained from sieve analyses of two soils: Sieve no. Opening (mm)…
A: "As per our guidelines we are supposed to do first three sub-parts, kindly post other sub-parts…
Q: % FINER SOIL B SIEVE SOIL A SOIL C 10 83 100 90 40 48 92 76 200 20 86 34 LL 20 70 37 PI 5 32 18…
A:
Q: Unified Soil Classification System Problem Set No. 6 Sieve No. Diameter Percent Finer (mm) 2. The…
A:
Q: The sieve analysis of ten soils and the liquid and plastic limits of the fraction passing through…
A: Note:- Hi! Thank you for the question, As per the honor code, we are allowed to answer three…
Q: Situation 10: A soil sample has water content of 25%, degree of saturation of 80%, and specific…
A: Given water content is 25 % specific gravity is 2.70 degree of saturation is 80 %
Q: 5.1 Classify the following soils using the U.S. Department of Agriculture textural classification…
A: Soil boundaries give an idea of its compatibility with soil and water or both compounds. When the…
Q: Classify the following soils using the Unified soil classification system. Give the group symbols…
A: Given:- The percent passing through the sieve of some soils are given Sieve size A B C D E No.…
Q: Using Unified Soil Classification System, determine the type of soil, the coefficient of gradation…
A:
Q: Classify the following soils using USCS give group symbol and group name. a) A 55% of soil sample…
A:
Q: Classify the following soil using U.S. Department of Agriculture textural classification chart.…
A:
Q: No. 200 sieve 100 80 Soil A Soil B 60 Figure 5.9 gives the grain-size distribution of two soils. The…
A: For soil A: Refer the grain size distribution curve, D10=0.09D30=0.15D60=0.2 It is required to…
Q: PROBLEM C The following are the results of shrinkage limit test: Determine the ff: Initial volume of…
A: The given data is as follows: Initial volume of the soil in saturated state=25.60 cm3Final volume of…
Q: Q2- Classify the soil of following properties according to Unified and Textural Classification…
A: given: L.L=40%P.L=35%
Q: Determine the percentage of Silts and Clays based on USCS for the grain-size characteristics of a…
A: First need to draw grain size distribution curve in semi log graph between sieve size on x axis and…
Q: PROBLEM NO. 3 For an inorganic soil, the following grain size analysis is given: U.S. Sieve No.…
A: Solution: Given: U.S. Sieve No. Diameter m(m) % Passing 4 4.75 100 10 2 90 20 0.85 64 40…
Q: The sieve analysis of ten soils and the liquid and plastic limits of the fraction passing through…
A: 1. Soil passing No. 200 sieve<35% So it is silt-clay which is further classified as A-4, A-5,…
Q: 4.6 Classify the following soils using the Unified classification system: Sieve analysis, % finer…
A: We are authorized to answer one question at a time, since you have not mentioned which question you…
Q: 2 Classify these soils according to AASHTO. Include the Group Index. Sieve analysis- Percent finer…
A: Based on data on the grain size distribution and Atterberg limits, the AASHTO system assigns a soil…
Q: For a given soil, the following are given in Table: Specific Gravity Gs, bulk unit weight γ), and…
A:
Q: 8. a) According to the results of a sieve analysis in Table 1 below, plot the sieve analysis graph…
A: A) Sieve Size (mm) Mass Retained (gms) % Weight Retained CCumulative % Retained % Finer =(100-%…
Q: 3. The grain-size analysis for a soil is given next: Sieve No. 4 10 20 40 60 100 200 % Passing 94 63…
A: Given: LL = 23% PL = 19% Sieve No. 200 Percentage passing = 3%
Q: SITUATION 1 A sample of soil has the following grain- size characteristics given below. Determine…
A:
Q: 40. The following water content data are from several plastic limit tests for a soil. Determine PL…
A: we will find water content for each test and take average.
Q: Classify the following soils, A through E, using the Unified Soil Classification System, including…
A: Following table gives results of sieve analysis and Atterberg limits test conducted on soils A,B,C,D…
Q: 6- For an inorganic soil, the following grain-size analysis is give Percent passing 100 U.S. Sieve…
A: Solution: a) AASHTO Soil Classification System Since 13% of the soil passes through the No. 200…
Q: Using the Unified Soil Classification System classify the following three soils: Sieve size Soil 1…
A: Solution: The unified soil classification depends on the percentage of soil passing through NO. 200…
Q: Classify all the soils in 5.8 using unified soil classification system. Give group symbols and the…
A: The chart for the unified soil classification system:
Q: Situation 2. The liquid limit and plastic limit of a soil are 56% and 12% respectively. 4. The above…
A: Plastic limit: the amount of moisture content at which the soil changes from plastic to a…
Q: Unified Soil Classification System Problem Set No. 6 1. Do hand drawing of the grain size…
A:
Q: Classify the following soils by using the Unified Soil Classification System. Give the group symbols…
A: The USCS classification chart is shown below:
Q: Classify the following soils using the Unified soil classification system. Percent passing Sieve…
A: Take soil B. Classification of Highway Subgrade Materials` from the textbook. Where the percentage…
Q: Classify the following soil using U.S. Department of Agriculture textural classification chart.…
A:
Q: 5.1 Classify the following soil using the U.S. Department of Agriculture textural classi- fication…
A: We are authorized to answer one question, since you have not mentioned which question you are…
Q: Classify the following soil using the U.S. Department of Agriculture textural classification chart.…
A: Given :- Consider the texture classification graph of soils.
Q: The sieve analysis of ten soils and the liquid and plastic limits of the fraction passing through…
A: "As per our guidelines we are supposed to solve for first three sub-parts, kindly submit other…
Q: The grain size curves for soils A, B and C is shown. It is required to classify the soils according…
A:
Q: 19. The following results were obtained from sieve analyses of two soils: Sieve no. Soil A Soil B…
A: Note - Solving remaining three sub-parts, (d) Consider as extraction D10,D30 and D60 for both the…
Q: Classify the following soils using the U.S. department of Agriculture textural classification chart.…
A:
show how you solve it
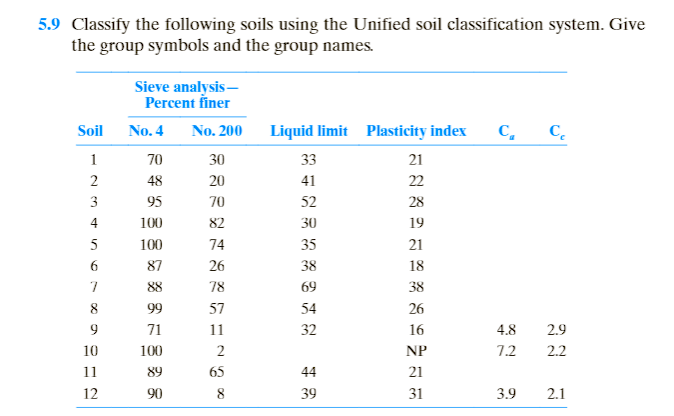
Trending now
This is a popular solution!
Step by step
Solved in 2 steps with 2 images
- Repeat Problem 2.11 with the following data. 2.11 The grain-size characteristics of a soil are given in the following table. a. Draw the grain-size distribution curve. b. Determine the percentages of gravel, sand, silt, and clay according to the MIT system. c. Repeat Part b using the USDA system. d. Repeat Part b using the AASHTO system.For an inorganic soil, the following grain-size analysis is given:Sieve No. % Passing4 10010 9020 6440 3880 18200 13For this soil, LL = 23% and PL = 19%. Classify the soil according to:a. The AASHTO soil classificationb. The Unified soil classification systemThe sieve analysis data for a granular soil are given below. % passing or finer 19 mm sieve = 100%% passing or finer 4.75 mm (4 sieve) = 61%% passing or finer 0.075mm (200 sieve) = 16% What are the percentages of gravels, sands and fines within this soil, based on the Unified Soil Classification System?
- Calculate the coefficient of gradation, Cc. ? Classify the soil by AASHTO and USCS system. (LL = 30, PL = 10) ? Use this given M=Mass of soil retained in pan +∑Mass reatianed in each sieve⇒M=617 gM=Mass of soil retained in pan +∑Mass reatianed in each sieve⇒M=617 g Sieve No. Opening Size (mm) Mass retained (g) %Mass retained=MiM×100=MiM×100 %Cumulative mass retained % Finer 4 4.750 28 =28617×100%=4.54%=28617×100%=4.54% 4.54 95.46 10 2.0 42 =42617×100%=6.81%=42617×100%=6.81% 11.35 88.65 20 0.850 48 =48617×100%=7.78%=48617×100%=7.78% 19.13 80.87 40 0.425 128 =128617×100%=20.74%=128617×100%=20.74% 39.87 60.13 60 0.250 221 =221617×100%=35.82%=221617×100%=35.82% 75.69 24.31 100 0.150 86 =86617×100%=13.94%=86617×100%=13.94% 89.63 10.37 200 0.075 40 =40617×100%=6.48%=40617×100%=6.48% 96.11 3.89 Pan 24 =24617×100%=3.89%=24617×100%=3.89% 100 0 Now, to plot the GSD curve, the % finer is kept on the vertical axis and the opening size are kept on the horizontal axis -…For an inorganic soil, the following grain size analysis is given U.S sieve NO. 4 10 20 40 80 200 percent passing 100 90 64 38 18 13 For this soil , L.L = 23 and PL = 19 classify the soil according to: a- The AASHTO soil classification system. b- The unified soil classification system . Give group names and group symbols.Determine the percentage of Clays based on AASHTO Soil classification system for the grain-size characteristics of a soil are given as follows: Round off your answer to two (2) decimal places. Size (mm) Percent Finer 0.850 100.00 0.425 92.10 0.250 85.80 0.150 77.30 0.075 62.00 0.040 50.80 0.020 41.00 0.010 34.30 0.006 29.00 0.002 23.00
- Question: For a given soil, the following are known: Percentage passing No. 4 sieve = 100 Percentage passing No. 200 sieve =61 Liquid limit = 26 Plastic Index =6 Classify the soil using the Unified Soil Classification System. Give the group symbol and the group name.Laboratory tests performed on a saturated alluvial subgrade soil gave the following information: In situ water content = 11.9%, Specific gravity = 2.65, Soil size distribution: D100 = 51 mm, D75 = 30 mm, D60 = 20 mm, D45 = 15 mm, D30 = 8 mm, D10 = 4.76 mm, D8 = 2 mm, D4 = 0.08 mm, < 2 m = 4% a. Is this soil well graded? Classify it by the AASHTO and Unified systems b. Using the sieve analysis soil data and the classification systems, estimate for a total of 100% the approximate percentages of coarse aggregate (gravel), fine aggregate (sand), silts, and clays?1. Classify the following soils using USCS givegroup symbol and group name.a) A 55% of soil sample retained in sieve no. 4and 89% retained on sieve no. 200. The soilsample has a liquid limit = 28% and plasticLimit = 18% Cu = 4.2, Cc = 1.4 2. A saturated soil has the followingcharacteristics:Initial Volume = 25 cm3Final Volume = 16 cm3Mass of wet soil = 45 gMass of dry soil = 31 ga) Determine the Shrinkage Limitb) Determine the Shrinkage Ratioc) Determine the Specific Gravity of the soil
- Determine the percentage of Silts and Clays based on USCS for the grain-size characteristics of a soil are given as follows: Round off your answer to two (2) decimal places. Size (mm) Percent Finer 0.850 100.00 0.425 92.10 0.250 85.80 0.150 77.30 0.075 62.00 0.040 50.80 0.020 41.00 0.010 34.30 0.006 29.00 0.002 23.00Classify all the soils in 5.8 using unified soil classification system. Give group symbols and the group namesNote: Give me both solutions with clear steps. A) The particle size distribution for Soil 1 is shown. What are the USCS group symbol and group name of this soil? B) The particle size distribution for Soil 2 is shown. The soil is inorganic and has the following Atterberg Limit values: LL=34 and PL=29. What are the USCS group symbol and group name for this soil?