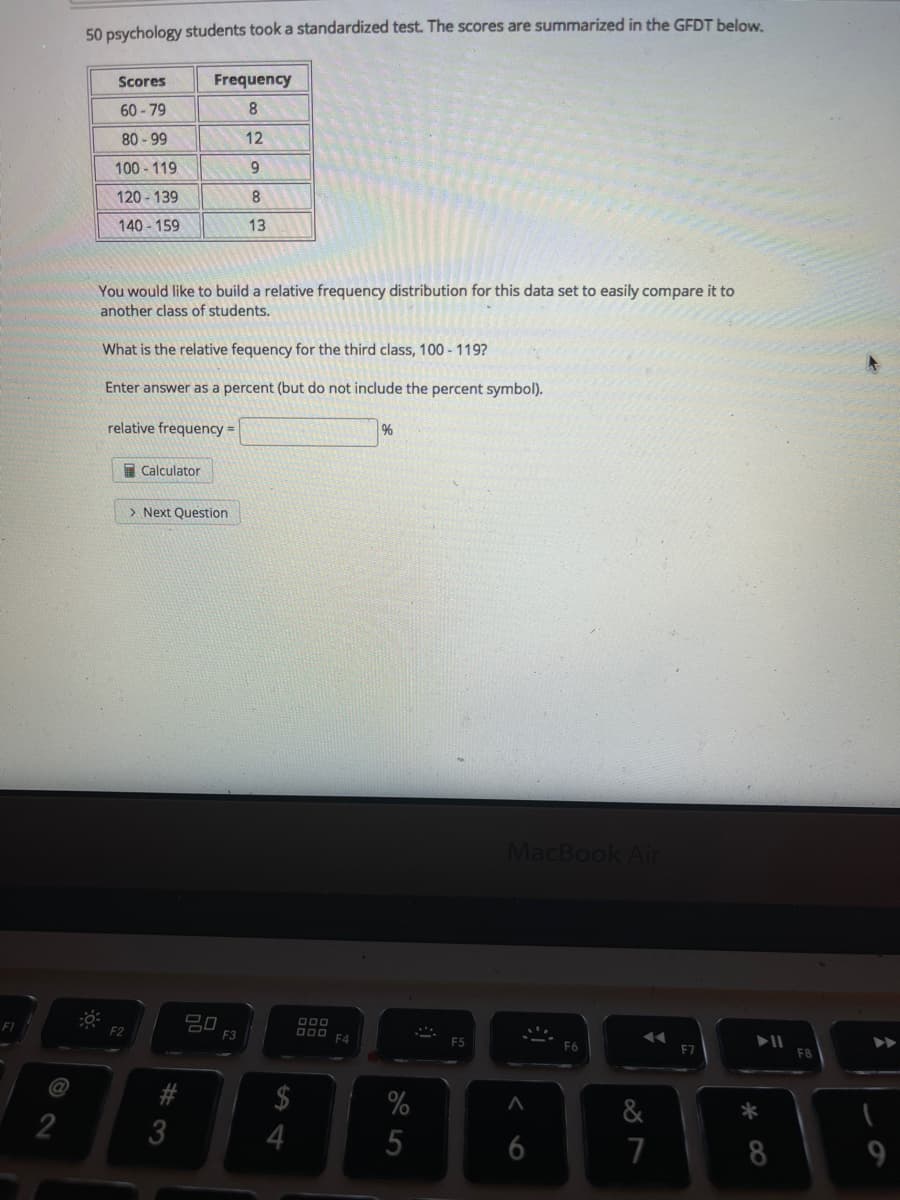
50 psychology students took a standardized test. The scores are summarized in the GFDT below. Scores Frequency 60- 79 80-99 12 100 - 119 9 120 - 139 140 - 159 13 You would like to build a relative frequency distribution for this data set to easily compare it to another class of students. What is the relative fequency for the third class, 100 - 119? Enter answer as a percent (but do not include the percent symbol). relative frequency = %


Inverse Normal Distribution
The method used for finding the corresponding z-critical value in a normal distribution using the known probability is said to be an inverse normal distribution. The inverse normal distribution is a continuous probability distribution with a family of two parameters.
Mean, Median, Mode
It is a descriptive summary of a data set. It can be defined by using some of the measures. The central tendencies do not provide information regarding individual data from the dataset. However, they give a summary of the data set. The central tendency or measure of central tendency is a central or typical value for a probability distribution.
Z-Scores
A z-score is a unit of measurement used in statistics to describe the position of a raw score in terms of its distance from the mean, measured with reference to standard deviation from the mean. Z-scores are useful in statistics because they allow comparison between two scores that belong to different normal distributions.


Trending now
This is a popular solution!

Step by step
Solved in 2 steps with 1 images


