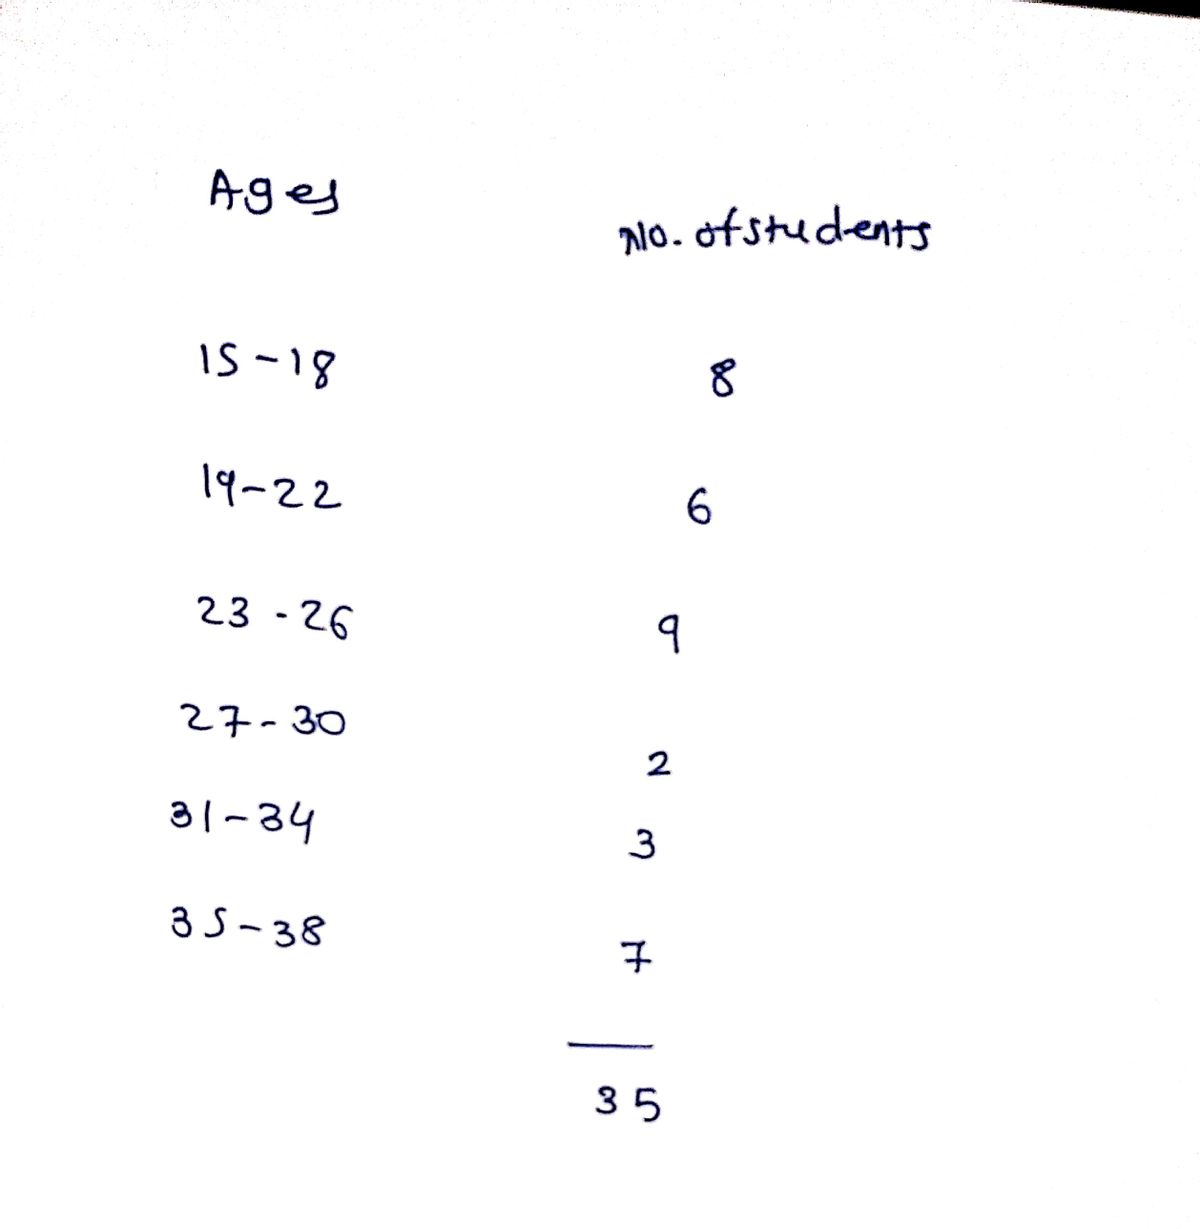
Ages Number of students 15-18 8 19-22 6 23-26 9 27-30 2 31-34 3 35-38 7 Based on the frequency distribution above, find the relative frequency for the class with lower class limit 27 Relative Frequency = % Give your answer as a percent, rounded to one decimal place Question HelpQuestion 17


Q: The height of women ages 20-29 is normally distributed, with a mean of 65 inches. Assume G = 2.7 inc...
A:
Q: Activity 3 Let X be a Poisson random variable with n = 300 and p = 0.02. Calculate the probabilities...
A:
Q: Directions: Identify the variables if it can be regarded as a response variable and if it can be use...
A: Given that We have to define which variable is response or prediction : Supply and Demand of certa...
Q: An online company is offering a date night special: pick one movie from five choices, one restaurant...
A: With the given information, it is to be interpreted that one "movie", one "restaurant", and one "ite...
Q: Mrs. Paul wants to test that claim that, on average, her students average mark is 85. She pulls the ...
A: The following information can be obtained from the output: Sample size (n) =100 --represented as "...
Q: From the values of the factors given below, find thẹ corrected values of the first four Moments abou...
A:
Q: iv. Calculate the value of the test statistics. At the 5% level of significance, determine if the Po...
A: Given: Population proportion of vaccinated citizens is p0 =0.95 Sample size, n=300 Number of people ...
Q: Do you find any association between the temperaments of brothers and sisters from the following data...
A:
Q: The proportion of all high school students who watch national news is p = 0.57. A random sample of 6...
A:
Q: random sample of size 2 from a population with a finite (2r)th moment, 5. For a) Find Mr b) Find E M...
A: @solution::::
Q: Problem 4. There are 1000 students in the year level and they have to participate in a certain activ...
A:
Q: Determine the system reliability if the three units function independently. froblem : A system a, b ...
A:
Q: Suppose in a class of 100 students who took an exam scored out of 100, the 68th percentile of the ex...
A:
Q: Problem 1: The average number of acres bumed by forest and range fires in a large New Mexico County ...
A: Since you have asked multiple question, we will solve the first question for you. If youwant any spe...
Q: Example 19-22. The values of x and y = f (x) are given below : 5 6 11 Uz: 12 13 14 16 Find the value...
A:
Q: selects 500 Florida residents and determines their mean age to be 58.2 years. However, according the...
A:
Q: At a gas station, 40% of the customers use regular gas (A1), 35% use midgrade gas (A2), and 25% use ...
A: Given Information: PA1=40%=0.40PA2=0.35PA3=0.25 PB|A1=30%=0.30PB|A2=0.60PB|A3=0.50 Then based on the...
Q: Solve it in Excel and walk through the process step by step to illustrate how it's done. Also, for t...
A: Given information: Top Bottom 26.3 26.22 26.43 26.32 26.28 26.2 26.19 26.11 26.49 26.4...
Q: construct a 95% confidence interval for the percentage of all such veterans who suffer from PDTD who...
A: We have given that, Favorable cases (X) = 43 and sample size (n)=319 Then, We will find the 95% c...
Q: Suppose you are given the following five pairs of scores: X Y 4 2 1 3 4 4 2 6 9 10 ...
A: Coefficient correlation : The Pearson correlation coefficient is a measure of linear correlation bet...
Q: kindly write legibly thank you! Enumerate and explain each briefly at least FOUR (4) Examples of th...
A: We have to explain Examples of Application of Statistics in Enginnering problem :
Q: Use the spinner below. 12 1 11 10 3 4 5 7 6 P(3 or 8) = %3D %3D 00
A:
Q: Consider a chain with 4 states and the following transition matrix. 1/2 1/2 0 1/3 1/3 1/3 0 1/4 1/4 ...
A: Given A chain with 4 states and the transition matrix.
Q: Find the standard deviation, s, of sample data summarized in the frequency distribution table below ...
A: Given: Interval Frequency 30-39 1 40-49 3 50-59 8 60-69 3 70-79 15 80-89 31 90-99 ...
Q: The prime Minister of a small Caribbean Island stated that 95% of the population was vaccinated from...
A: Given: Sr. No. Data (x) 1 12 2 18 3 9 4 16 5 11 6 10 7 8
Q: 1. The following data are Mathematics scores of students grouped according to type of high school th...
A: Given information: Private Public 79 77 74 78 80 85 67 90 68 89 78 82 88 90 92 9...
Q: Whole life insurance Age Lives Actuarial Value Second Moment 55 7,963.68 0.311490 0.147065 65 6,752....
A: “Since you have posted a question with multiple sub-parts, we will solve first three subparts for yo...
Q: A fair coin is tossed twice. Let X be the number of tails that are observed. a.) Construct the proba...
A: Given that A fair coin is tossed twice . Number of trails (n) = 2 Total number of outcomes = 22 = 4...
Q: Mrs. Paul wants to test that claim that, on average, her students average mark is 85. She pulls the ...
A: Hi! Thank you for the question, as per the honor code, we are allowed to answer three sub-parts at a...
Q: What percent of a standard Normal model is found in each region? a) z>1.7 Find the percent of the...
A: a) Here we have to find P( z > 1.7 )
Q: The prime Minister of a small Caribbean Island stated that 95% of the population was vaccinated from...
A: According our policy we can answer only first question for remaining please repost the question.
Q: What is the probability of getting at least 4 in one roll of a die?
A: Sample space for rolling a die is S = {1, 2,3,4,5,6}
Q: Two random variables have the regression equations : 3 X+ 2Y- 26 = 0 6X+ Y- 31 = 0 Find the mean val...
A:
Q: Problem 2.11 A random sample X,....,X+1 is taken from a distribution with PDF f. Let Y,..., Y2+1 be ...
A:
Q: 2) A large industrial explosion occurred near a densely populated region in a major city. The result...
A: Given data >60: High Exposure 40-59: Medium Exposure 20-39: Low Exposure <20: No exposure 2...
Q: relationship between the unemployment rate and In the short run there is the rate of inflation. A) a...
A: Solution-: We find the correct option In the short run there is ....... relationship between the une...
Q: Apartment renting is one of the most affected business due to Covid Pandemic. It shows a reasonable ...
A: Given that n=49 , alpha =0.05 ,x bar = 280 , sigma = 40 ,mu =295 Carry out hypothesis test to determ...
Q: Suppose a random sample of size 43 is selected from a population with o= 11. Find the value of the s...
A:
Q: Problem : A system has two units connected in parallel with the following information. The failure r...
A:
Q: The plasticity of a polyethylene is affected by the concentration of a solution. When low concentrat...
A: Introduction: Denote Xhigh, Xlow as the plasticity of a randomly selected polyethylene, when a low a...
Q: 1. As a result of the Covid crisis, a large number of households faced destitution – lacking suffici...
A: As per our guidelines we are suppose to answer three sub parts. Given,A random variable X~Poisson(λ=...
Q: 26, 28, 31, 28, 37, 33, 46, 39, 29, 43, 49, 30, 40, 38, 39 Using StatKey or other technology, find t...
A:
Q: 3. A box contains four 40 W bulbs, five 60 W bulbs, and six 75 W bulbs. (a) If two bulbs are randoml...
A: Given : Number of 40 W bulbs=4 Number of 60 W bulbs =5 Number of 75W bulbs =6 Total number of bulbs ...
Q: Detemine whether the graph shown could represent a variable with a nomal distribution. Explain your ...
A:
Q: Show complete solution The distribution of heights of adult Filipino men is approximately Normal wit...
A:
Q: An oil company estimates that only 1 well in 17 will yield commercial quantities of oil. Assume that...
A:
Q: Directions: Identify the variables if it can be regarded as a response variable and if it can be use...
A: We need to identify the variables if it can be regarded as a response variable or as a predictors. T...
Q: Q5. Let's assume X is a random variable which represents the number of years in which randomly chose...
A: Given, total frequency = 500 16+p+189+115+q = 500 p +q = 180 ....(1)
Q: From past experience, Rebecca estimates that when she is on the college campus, the following probab...
A: GivenThe probability that Rebecca will study for her statistics exam is =65%P(Statistics)=0.65The pr...
Q: The data file includes the text of three books of the Bible (Joshua, Jonah and Philippians) using th...
A: Given information: A 1810 B 323 C 442 D 1097 E 2845 F 609 G 416 H 1689 I 1381 J...
| Ages | Number of students |
|---|---|
| 15-18 | 8 |
| 19-22 | 6 |
| 23-26 | 9 |
| 27-30 | 2 |
| 31-34 | 3 |
| 35-38 | 7 |
Based on the frequency distribution above, find the relative frequency for the class with lower class limit 27
Relative Frequency = %
Give your answer as a percent, rounded to one decimal place

Trending now
This is a popular solution!

Step by step
Solved in 2 steps with 2 images

- Isle Royale, an island in Lake Superior, has provided an important study site of wolves and their prey. Of special interest is the study of the number of moose killed by wolves. In the period from 1958 to 1974, there were 296 moose deaths identified as wolf kills. The age distribution of the kills is as follows. Age of Moose in Years Number Killed by Wolves Calf (0.5 yr)1-56-1011-1516-20 1105074575 Consider all ages in a class equal to the class midpoint. Find the expected age of a moose killed by a wolf and the standard deviation of the ages. (Round your answers to two decimal places.)Categorical and Frequency Distributionrandom sample of 16 subjects The ages were: Assuming that age is normally distributed in the population, can we conclude that the mean age of the population is less than 60 years? Let α = 0.05.
- The age of children in kindergarten on the first day of school is uniformly distributed between 4.88 and 5.94 years old. A first time kindergarten child is selected at random. Round answers to 4 decimal places if possible. If such a child is at the 87th percentile, how old is that child? ____ years old.distribution of candidates who were enrolled for the mba entrace exam and the candidates (out of those enrolled) who passed the exam in different institutes CANDIDATES ENROLLED =8550 X-16%, P- 22%, Q-15%, R-10%, S-17%, T-8%, V-12% CANDIDATES PASSED= 5700 X- 12%, P-18%, Q-17%, R-13%, S-16%, T-9%, V-15% a) What percentage of candidates passed the Exam from institute T out of the total number ofcandidates enrolled from the same institute?b) Which institute has the highest percentage of candidates that passed to the candidates enrolled?c) By how many candidates, does the number who passed institutes S and P together exceeds thenumber of candidates enrolled from institutes T and R together?Using 68-95-99.7% rule to indicate quantities In a study of facial behavior, people in the control group are timed for eye contact in a 5-minute period. Their times are normally distributed with a mean of 183.0 seconds and a standard of 55.0 seconds. What percent of times will between 73 and 293 seconds? what percent of times will be over 238 seconds? Suppose that 800 people were assigned to this control group. How many people will be with time over 238?
- .59. Potatoes. A high-quality product is one that is consistent and has very little variability in its characteristics. Controlling variability can be more difficult with agricultural products than with those that are manufactured. The following table gives the weights, in ounces, of the 25 potatoes sold in a 10-pound bag. (a) Summarize the data graphically and numerically. Give reasons for the methods you chose to use in your summaries. (b) Do you think that your numerical summaries do an effective job of describing these data? Why or why not? (c) There appear to be two distinct clusters of weights for these potatoes. Divide the sample into two subsamples based on the clustering. Give the mean and standard deviation for each subsample. Do you think that this way of summarizing these data is better than a numerical summary that uses all the data as a single sample? Give a reason for your answer.A uniform distribution has a minimum of six and a maximum of ten. A sample of 50 is taken.Find the 70th percentile for the sums. (Round your answer to two decimal places.) How is the central limit theorem for sums z-score formula used to find the percentile?RELATIVE FREQUENCY DISTRIBUTION Use percentages to construct the relative frequency distribution corresponding to the accompanying frequency distribution for daily commute time in Boston.
- distribution of candidates who were enrolled for the mba entrace exam and the candidates (out of those enrolled) who passed the exam in different institutes CANDIDATES ENROLLED =8550 X-16%, P- 22%, Q-15%, R-10%, S-17%, T-8%, V-12% CANDIDATES PASSED= 5700 X- 12%, P-18%, Q-17%, R-13%, S-16%, T-9%, V-15% a) What is the percentage of candidates passed to the candidates enrolled for institutes Q and Rtogether?b) What is the ratio of candidates passed to the candidates enrolled from institute P?c)What makes the candidate fail the exam?USING 8 AS THE LOWER LIMIT OF THE CLASS AND WITH A WIDTH OF 1 UNIT, CONVERT IT TO FREQUENCY DISTRIBUTIONSpeeds of automobiles on a certain stretch of freeway at 11:00 PM are normally distributed with mean 65 mph. Twenty percent of the cars are traveling at speeds between 55 and 65 mph. What percentage of the cars are going faster than 75 mph?