52 30 44 350 47 37 56 26 30 44 37 37 Click the icon to view the table of critical correlation coefficient values for normal probability plots. (b) Draw a boxplot to check for outliers. Choose the correct answer below. O A. O B. Oc. OD. 20 30 40 50 60 20 30 40 50 60 20 30 40 50 60 20 30 40 50 60 Does the boxplot suggest that there are outliers? O A. No, there are no points that are outside of the 1.5(IQR) boundaries. O B. Yes, there is at least one point that is greater than the third quartile less than the first quartile. OC. Yes, there is at least one point that is outside of the 1.5(IQR) boundaries. O D. No, there are no points that are greater than the third quartile or less than the first quartile. (c) Construct and interpret a 95% confidence interval for the mean age at which a baby first crawls. Select the correct choice below and fill in the answer boxes to complete your choice. (Round to one decimal place as needed. Use ascending order.) O A. There is a 95% probability that the mean age which a baby first crawls is between weeks and weeks. O B. We are 95% confident that the mean age at which a baby first crawls is between weeks and weeks
52 30 44 350 47 37 56 26 30 44 37 37 Click the icon to view the table of critical correlation coefficient values for normal probability plots. (b) Draw a boxplot to check for outliers. Choose the correct answer below. O A. O B. Oc. OD. 20 30 40 50 60 20 30 40 50 60 20 30 40 50 60 20 30 40 50 60 Does the boxplot suggest that there are outliers? O A. No, there are no points that are outside of the 1.5(IQR) boundaries. O B. Yes, there is at least one point that is greater than the third quartile less than the first quartile. OC. Yes, there is at least one point that is outside of the 1.5(IQR) boundaries. O D. No, there are no points that are greater than the third quartile or less than the first quartile. (c) Construct and interpret a 95% confidence interval for the mean age at which a baby first crawls. Select the correct choice below and fill in the answer boxes to complete your choice. (Round to one decimal place as needed. Use ascending order.) O A. There is a 95% probability that the mean age which a baby first crawls is between weeks and weeks. O B. We are 95% confident that the mean age at which a baby first crawls is between weeks and weeks

MATLAB: An Introduction with Applications
6th Edition
ISBN:9781119256830
Author:Amos Gilat
Publisher:Amos Gilat
Chapter1: Starting With Matlab
Section: Chapter Questions
Problem 1P

Related questions
Question
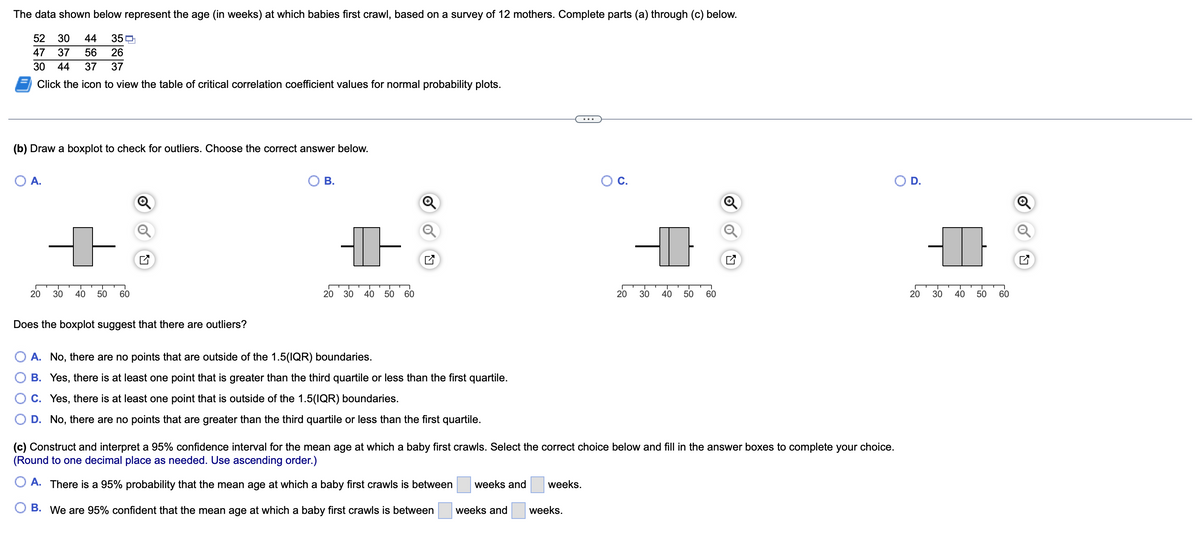
Transcribed Image Text:The data shown below represent the age (in weeks) at which babies first crawl, based on a survey of 12 mothers. Complete parts (a) through (c) below.
52
30
44
350
47
37
56
26
30
44
37
37
Click the icon to view the table of critical correlation coefficient values for normal probability plots.
(b) Draw a boxplot to check for outliers. Choose the correct answer below.
O A.
В.
OC.
D.
Q
20
30
40
50
60
20
30
40
50
60
20
30
40
50
60
20
30
40
50
60
Does the boxplot suggest that there are outliers?
A. No, there are no points that are outside of the 1.5(IQR) boundaries.
B. Yes, there is at least one point that is greater than the third quartile or less than the first quartile.
C. Yes, there is at least one point that is outside of the 1.5(IQR) boundaries.
D. No, there are no points that are greater than the third quartile or less than the first quartile.
(c) Construct and interpret a 95% confidence interval for the mean age at which a baby first crawls. Select the correct choice below and fill in the answer boxes to complete your choice.
(Round to one decimal place as needed. Use ascending order.)
A. There is a 95% probability that the mean age at which a baby first crawls is between
weeks and
weeks.
B. We are 95% confident that the mean age at which a baby first crawls is between
weeks and
weeks.
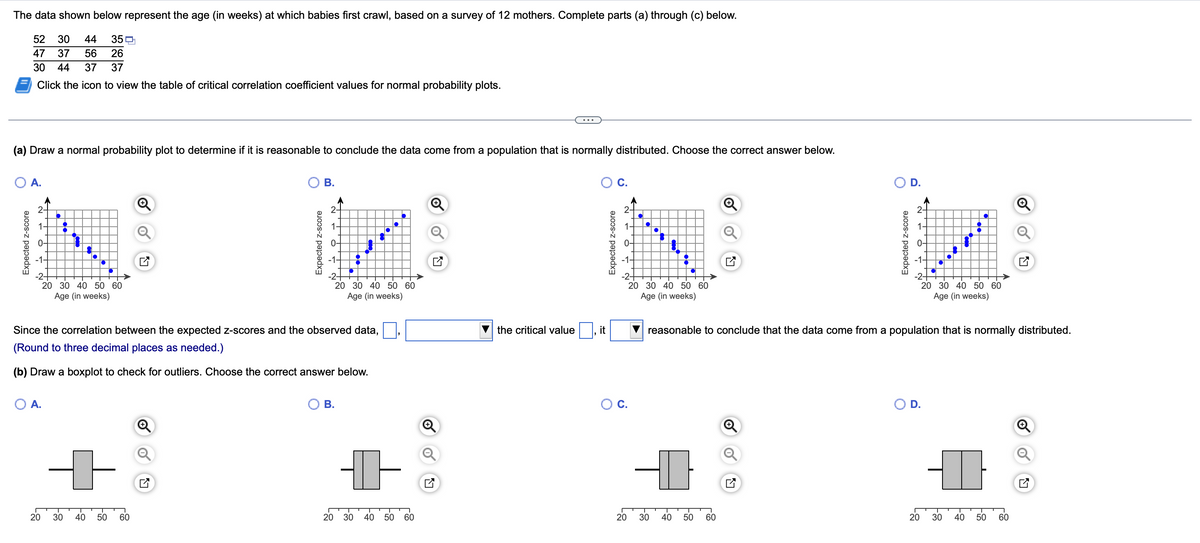
Transcribed Image Text:The data shown below represent the age (in weeks) at which babies first crawl, based on a survey of 12 mothers. Complete parts (a) through (c) below.
52
30
44
35 0
47
37
56
26
30
44
37
37
Click the icon to view the table of critical correlation coefficient values for normal probability plots.
(a) Draw a normal probability plot to determine if it is reasonable to conclude the data come from a population that is normally distributed. Choose the correct answer below.
O A.
C.
D.
iz
2-
2-
2-
20 30 40 50 60
Age (in weeks)
20 30 40 50 60
Age (in weeks)
20 30 40 50 60
20 30 40 50 60
Age (in weeks)
Age (in weeks)
Since the correlation between the expected z-scores and the observed data,
the critical value
, it
reasonable to conclude that the data come from a population that is normally distributed.
(Round to three decimal places as needed.)
(b) Draw a boxplot to check for outliers. Choose the correct answer below.
O A.
В.
C.
D.
20
30
40
50
60
20
30
40
50
60
20
30
40
50
60
20
30
40
50
60
Expected z-score
Expected z-score
B.
Expected z-score
Expected z-score
Expert Solution
This question has been solved!
Explore an expertly crafted, step-by-step solution for a thorough understanding of key concepts.

This is a popular solution!

Trending now
This is a popular solution!

Step by step
Solved in 5 steps with 3 images

Recommended textbooks for you
MATLAB: An Introduction with Applications
Statistics
ISBN:
9781119256830
Author:
Amos Gilat
Publisher:
John Wiley & Sons Inc

Probability and Statistics for Engineering and th…
Statistics
ISBN:
9781305251809
Author:
Jay L. Devore
Publisher:
Cengage Learning

Statistics for The Behavioral Sciences (MindTap C…
Statistics
ISBN:
9781305504912
Author:
Frederick J Gravetter, Larry B. Wallnau
Publisher:
Cengage Learning
MATLAB: An Introduction with Applications
Statistics
ISBN:
9781119256830
Author:
Amos Gilat
Publisher:
John Wiley & Sons Inc
Probability and Statistics for Engineering and th…
Statistics
ISBN:
9781305251809
Author:
Jay L. Devore
Publisher:
Cengage Learning
Statistics for The Behavioral Sciences (MindTap C…
Statistics
ISBN:
9781305504912
Author:
Frederick J Gravetter, Larry B. Wallnau
Publisher:
Cengage Learning

Elementary Statistics: Picturing the World (7th E…
Statistics
ISBN:
9780134683416
Author:
Ron Larson, Betsy Farber
Publisher:
PEARSON

The Basic Practice of Statistics
Statistics
ISBN:
9781319042578
Author:
David S. Moore, William I. Notz, Michael A. Fligner
Publisher:
W. H. Freeman

Introduction to the Practice of Statistics
Statistics
ISBN:
9781319013387
Author:
David S. Moore, George P. McCabe, Bruce A. Craig
Publisher:
W. H. Freeman