6-76. + Reconsider the water quality data in Exercise 6-40. Construct a box plot of the concentrations and write an inter- pretation of the plot. How does the box plot compare in inter- pretive value to the original stem-and-leaf diagram?
6-76. + Reconsider the water quality data in Exercise 6-40. Construct a box plot of the concentrations and write an inter- pretation of the plot. How does the box plot compare in inter- pretive value to the original stem-and-leaf diagram?

Glencoe Algebra 1, Student Edition, 9780079039897, 0079039898, 2018
18th Edition
ISBN:9780079039897
Author:Carter
Publisher:Carter
Chapter10: Statistics
Section10.4: Distributions Of Data
Problem 19PFA

Related questions

Question
in this question I am asking, only answer exercise 6-76 preferably.
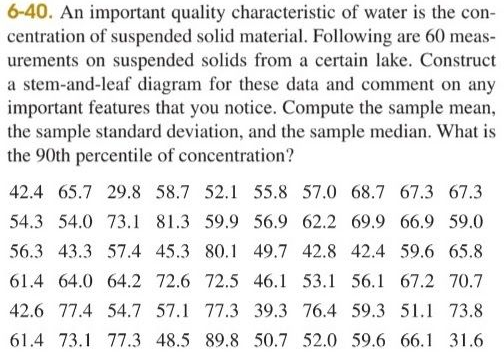
Transcribed Image Text:6-40. An important quality characteristic of water is the con-
centration of suspended solid material. Following are 60 meas-
urements on suspended solids from a certain lake. Construct
a stem-and-leaf diagram for these data and comment on any
important features that you notice. Compute the sample mean,
the sample standard deviation, and the sample median. What is
the 90th percentile of concentration?
42.4 65.7 29.8 58.7 52.1 55.8 57.0 68.7 67.3 67.3
54.3 54.0 73.1 81.3 59.9 56.9 62.2 69.9 66.9 59.0
56.3 43.3 57.4 45.3 80.1 49.7 42.8 42.4 59.6 65.8
61.4 64.0 64.2 72.6 72.5 46.1 53.1 56.1 67.2 70.7
42.6 77.4 54.7 57.1 77.3 39.3 76.4 59.3 51.1 73.8
61.4 73.1 77.3 48.5 89.8 50.7 52.0 59.6 66.1 31.6
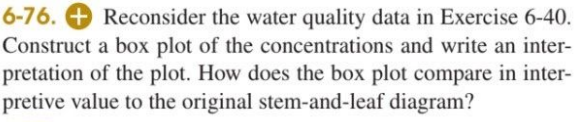
Transcribed Image Text:6-76. + Reconsider the water quality data in Exercise 6-40.
Construct a box plot of the concentrations and write an inter-
pretation of the plot. How does the box plot compare in inter-
pretive value to the original stem-and-leaf diagram?
Expert Solution
This question has been solved!
Explore an expertly crafted, step-by-step solution for a thorough understanding of key concepts.

Step by step
Solved in 2 steps with 1 images

Knowledge Booster


Learn more about
Need a deep-dive on the concept behind this application? Look no further. Learn more about this topic, probability and related others by exploring similar questions and additional content below.Recommended textbooks for you
Glencoe Algebra 1, Student Edition, 9780079039897…
Algebra
ISBN:
9780079039897
Author:
Carter
Publisher:
McGraw Hill
Glencoe Algebra 1, Student Edition, 9780079039897…
Algebra
ISBN:
9780079039897
Author:
Carter
Publisher:
McGraw Hill