Give a mathematical model to investigate the relationship between one independent variable and dependent variable. Carry out appropriate tests for the significance of the relationship between the data and state the conclusions. Please show the data that you have used and please also provide step by step analysis until you reach the conclusion.
Give a mathematical model to investigate the relationship between one independent variable and dependent variable. Carry out appropriate tests for the significance of the relationship between the data and state the conclusions. Please show the data that you have used and please also provide step by step analysis until you reach the conclusion.

Glencoe Algebra 1, Student Edition, 9780079039897, 0079039898, 2018
18th Edition
ISBN:9780079039897
Author:Carter
Publisher:Carter
Chapter10: Statistics
Section10.6: Summarizing Categorical Data
Problem 28PPS

Related questions
Question
100%
Give a mathematical model to investigate the relationship between one independent variable and dependent variable. Carry out appropriate tests for the significance of the relationship between the data and state the conclusions. Please show the data that you have used and please also provide step by step analysis until you reach the conclusion.
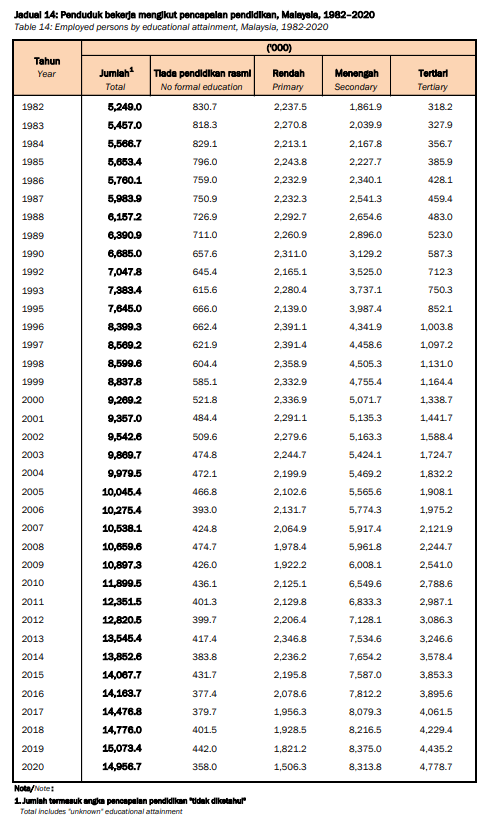
Transcribed Image Text:Jadual 14: Penduduk bekerja menglkut pencapelan pendidlkan, Malaysla, 1982-2020
Table 14: Employed persons by educational attainment, Malaysia, 1982-2020
(000)
Tahun
Jumlah
Tlade pendidlkan rasml
Rendah
Menengah
Tertlari
Year
Total
No formal education
Primary
Secondary
Tertiary
1982
5,249.0
830.7
2,237.5
1,861.9
318.2
1983
5,457.0
818.3
2,270.8
2,039.9
327.9
1984
5,566.7
829.1
2,213.1
2,167.8
356.7
1985
5,653.4
796.0
2,243.8
2,227.7
385.9
1986
Б,760.1
759.0
2,232.9
2,340.1
428.1
1987
5,983.9
750.9
2,232.3
2,541.3
459.4
1988
6,157.2
726.9
2,292.7
2,654.6
483.0
1989
6,390.9
711.0
2,260.9
2,896.0
523.0
1990
6,685.0
657.6
2,311.0
3,129.2
587.3
1992
7,047.8
645.4
2,165.1
3,525.0
712.3
1993
7,383.4
615.6
2,280.4
3,737.1
750.3
1995
7,645.0
666.0
2,139.0
3,987.4
852.1
1996
8,399.3
662.4
2,391.1
4,341.9
1,003.8
1997
8,569.2
621.9
2,391.4
4,458.6
1,097.2
1998
8,599.6
604.4
2,358.9
4,505.3
1,1310
1999
8,837.8
585.1
2,332.9
4,755.4
1,164.4
2000
9,269.2
521.8
2,336.9
5,071.7
1,338.7
2001
9,357.0
484.4
2,2911
5,135.3
1,4417
2002
9,542.6
509.6
2,279.6
5,163.3
1,588.4
2003
9,869.7
474.8
2,244.7
5,424.1
1,724.7
2004
9,979.5
472.1
2,199.9
5,469.2
1,832.2
2005
10,045.4
466.8
2,102.6
5,565.6
1,908.1
2006
10,275.4
393.0
2,131.7
5,774.3
1,975.2
2007
10,538.1
424.8
2,064.9
5,917.4
2,121.9
2008
10,659.6
474.7
1,978.4
5,961.8
2,244.7
2009
10,897.3
426.0
1,922.2
6,008.1
2,541.0
2010
11,899.5
436.1
2,125.1
6,549.6
2,788.6
2011
12,351.5
401.3
2,129.8
6,833.3
2,987.1
2012
12,820.5
399.7
2,206.4
7,128.1
3,086.3
2013
13,545.4
417.4
2,346.8
7,534.6
3,246.6
2014
13,852.6
383.8
2,236.2
7,654.2
3,578.4
2015
14,067.7
431.7
2,195.8
7,587.0
3,853.3
2016
14,163.7
377.4
2,078.6
7,812.2
3,895.6
2017
14,476.8
379.7
1,956.3
8,079.3
4,061.5
2018
14,776.0
401.5
1,928.5
8,216.5
4,229.4
2019
15,073.4
442.0
1,821.2
8,375.0
4,435.2
2020
14,956.7
358.0
1,506.3
8,313.8
4,778.7
Nota/Note:
1.Jumlah termesuk angka pencapalan pendidlkan "udak dlkatahul
Total includes "unknown" educational attainment
Expert Solution
This question has been solved!
Explore an expertly crafted, step-by-step solution for a thorough understanding of key concepts.

Step by step
Solved in 3 steps with 1 images

Recommended textbooks for you
Glencoe Algebra 1, Student Edition, 9780079039897…
Algebra
ISBN:
9780079039897
Author:
Carter
Publisher:
McGraw Hill
Glencoe Algebra 1, Student Edition, 9780079039897…
Algebra
ISBN:
9780079039897
Author:
Carter
Publisher:
McGraw Hill