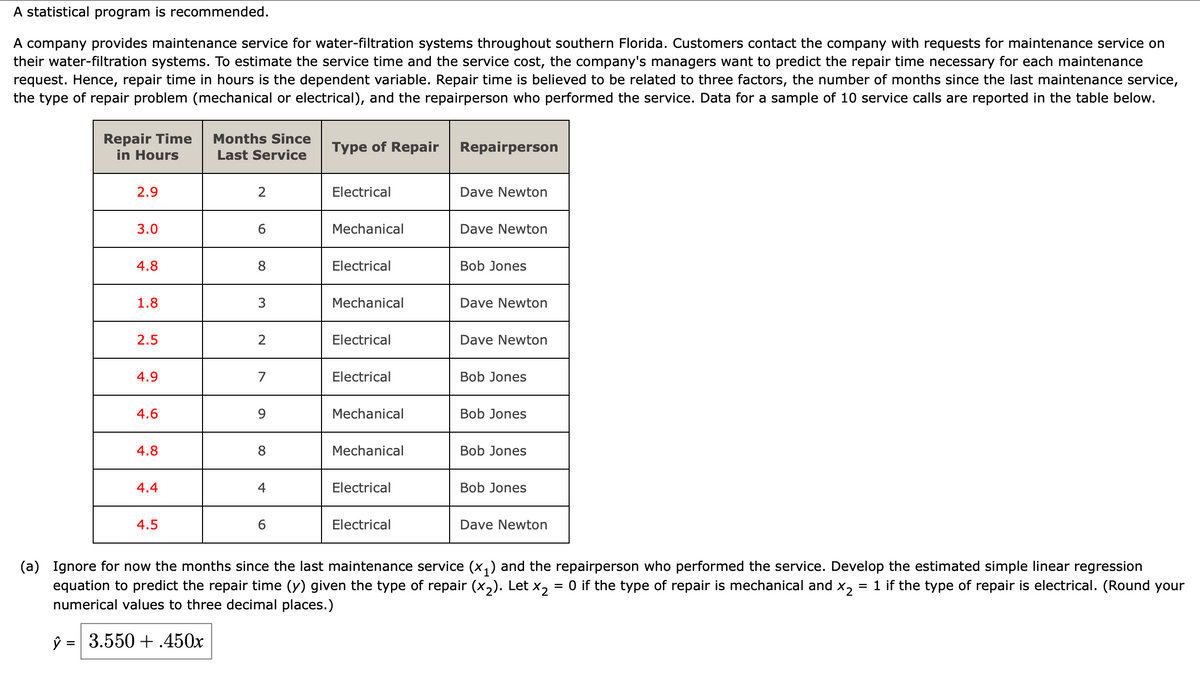
A statistical program is recommended. A company provides maintenance service for water-filtration systems throughout southern Florida. Customers contact the company with requests for maintenance service on their water-filtration systems. To estimate the service time and the service cost, the company's managers want to predict the repair time necessary for each maintenance request. Hence, repair time in hours is the dependent variable. Repair time is believed to be related to three factors, the number of months since the last maintenance service, the type of repair problem (mechanical or electrical), and the repairperson who performed the service. Data for a sample of 10 service calls are reported in the table below. Repair Time in Hours Months Since Last Service Type of Repair Repairperson 2.9 2 Electrical Dave Newton 3.0 6. Mechanical Dave Newton 4.8 8 Electrical Bob Jones 1.8 Mechanical Dave Newton 2.5 2 Electrical Dave Newton 4.9 7 Electrical Bob Jones 4.6 Mechanical Bob Jones 4.8 Mechanical Bob Jones 4.4 4 Electrical Bob Jones 4.5 Electrical Dave Newton (a) Ignore for now the months since the last maintenance service (x,) and the repairperson who performed the service. Develop the estimated simple linear regression equation to predict the repair time (y) given the type of repair (xɔ). Let x, = 0 if the type of repair is mechanical and x, = 1 if the type of repair is electrical. (Round your numerical values to three decimal places.) ŷ = 3.550 + .450x
A statistical program is recommended. A company provides maintenance service for water-filtration systems throughout southern Florida. Customers contact the company with requests for maintenance service on their water-filtration systems. To estimate the service time and the service cost, the company's managers want to predict the repair time necessary for each maintenance request. Hence, repair time in hours is the dependent variable. Repair time is believed to be related to three factors, the number of months since the last maintenance service, the type of repair problem (mechanical or electrical), and the repairperson who performed the service. Data for a sample of 10 service calls are reported in the table below. Repair Time in Hours Months Since Last Service Type of Repair Repairperson 2.9 2 Electrical Dave Newton 3.0 6. Mechanical Dave Newton 4.8 8 Electrical Bob Jones 1.8 Mechanical Dave Newton 2.5 2 Electrical Dave Newton 4.9 7 Electrical Bob Jones 4.6 Mechanical Bob Jones 4.8 Mechanical Bob Jones 4.4 4 Electrical Bob Jones 4.5 Electrical Dave Newton (a) Ignore for now the months since the last maintenance service (x,) and the repairperson who performed the service. Develop the estimated simple linear regression equation to predict the repair time (y) given the type of repair (xɔ). Let x, = 0 if the type of repair is mechanical and x, = 1 if the type of repair is electrical. (Round your numerical values to three decimal places.) ŷ = 3.550 + .450x

Glencoe Algebra 1, Student Edition, 9780079039897, 0079039898, 2018
18th Edition
ISBN:9780079039897
Author:Carter
Publisher:Carter
Chapter4: Equations Of Linear Functions
Section4.5: Correlation And Causation
Problem 11PPS

Related questions

Topic Video
Question
Transcribed Image Text:A statistical program is recommended.
A company provides maintenance service for water-filtration systems throughout southern Florida. Customers contact the company with requests for maintenance service on
their water-filtration systems. To estimate the service time and the service cost, the company's managers want to predict the repair time necessary for each maintenance
request. Hence, repair time in hours is the dependent variable. Repair time is believed to be related to three factors, the number of months since the last maintenance service,
the type of repair problem (mechanical or electrical), and the repairperson who performed the service. Data for a sample of 10 service calls are reported in the table below.
Repair Time
in Hours
Months Since
Type of Repair Repairperson
Last Service
2.9
Electrical
Dave Newton
3.0
6.
Mechanical
Dave Newton
4.8
8
Electrical
Bob Jones
1.8
3
Mechanical
Dave Newton
2.5
Electrical
Dave Newton
4.9
7
Electrical
Bob Jones
4.6
9.
Mechanical
Bob Jones
4.8
8
Mechanical
Bob Jones
4.4
4
Electrical
Bob Jones
4.5
6.
Electrical
Dave Newton
(a) Ignore for now the months since the last maintenance service (x,) and the repairperson who performed the service. Develop the estimated simple linear regression
equation to predict the repair time (y) given the type of repair (x2). Let x,
numerical values to three decimal places.)
= 0 if the type of repair is mechanical and x, = 1 if the type of repair is electrical. (Round your
ŷ = 3.550 + .450x
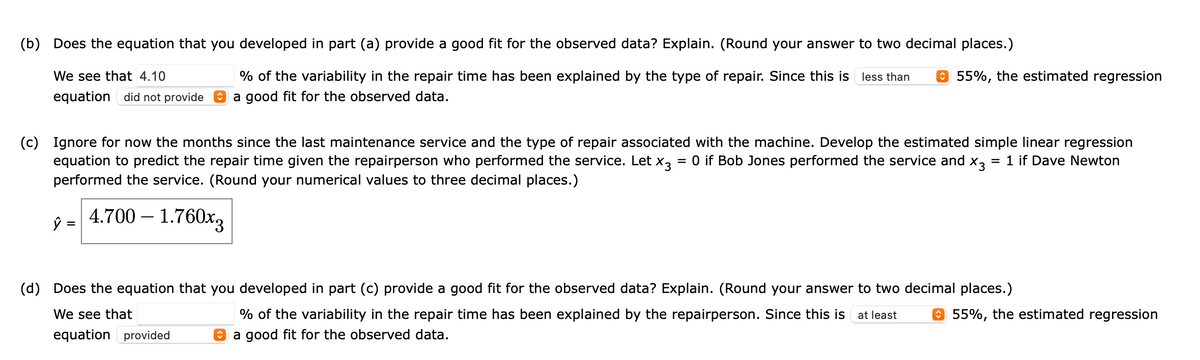
Transcribed Image Text:(b) Does the equation that you developed in part (a) provide a good fit for the observed data? Explain. (Round your answer to two decimal places.)
We see that 4.10
% of the variability in the repair time has been explained by the type of repair. Since this is less than
O 55%, the estimated regression
equation did not provide O a good fit for the observed data.
(c) Ignore for now the months since the last maintenance service and the type of repair associated with the machine. Develop the estimated simple linear regression
equation to predict the repair time given the repairperson who performed the service. Let x3
performed the service. (Round your numerical values to three decimal places.)
= 0 if Bob Jones performed the service and x,
= 1 if Dave Newton
4.700 – 1.760x3
(d) Does the equation that you developed in part (c) provide a good fit for the observed data? Explain. (Round your answer to two decimal places.)
We see that
% of the variability in the repair time has been explained by the repairperson. Since this is at least
O 55%, the estimated regression
equation provided
O a good fit for the observed data.
Expert Solution
This question has been solved!
Explore an expertly crafted, step-by-step solution for a thorough understanding of key concepts.

This is a popular solution!

Trending now
This is a popular solution!

Step by step
Solved in 4 steps

Knowledge Booster


Learn more about
Need a deep-dive on the concept behind this application? Look no further. Learn more about this topic, statistics and related others by exploring similar questions and additional content below.Recommended textbooks for you
Glencoe Algebra 1, Student Edition, 9780079039897…
Algebra
ISBN:
9780079039897
Author:
Carter
Publisher:
McGraw Hill

Big Ideas Math A Bridge To Success Algebra 1: Stu…
Algebra
ISBN:
9781680331141
Author:
HOUGHTON MIFFLIN HARCOURT
Publisher:
Houghton Mifflin Harcourt

Holt Mcdougal Larson Pre-algebra: Student Edition…
Algebra
ISBN:
9780547587776
Author:
HOLT MCDOUGAL
Publisher:
HOLT MCDOUGAL
Glencoe Algebra 1, Student Edition, 9780079039897…
Algebra
ISBN:
9780079039897
Author:
Carter
Publisher:
McGraw Hill
Big Ideas Math A Bridge To Success Algebra 1: Stu…
Algebra
ISBN:
9781680331141
Author:
HOUGHTON MIFFLIN HARCOURT
Publisher:
Houghton Mifflin Harcourt
Holt Mcdougal Larson Pre-algebra: Student Edition…
Algebra
ISBN:
9780547587776
Author:
HOLT MCDOUGAL
Publisher:
HOLT MCDOUGAL