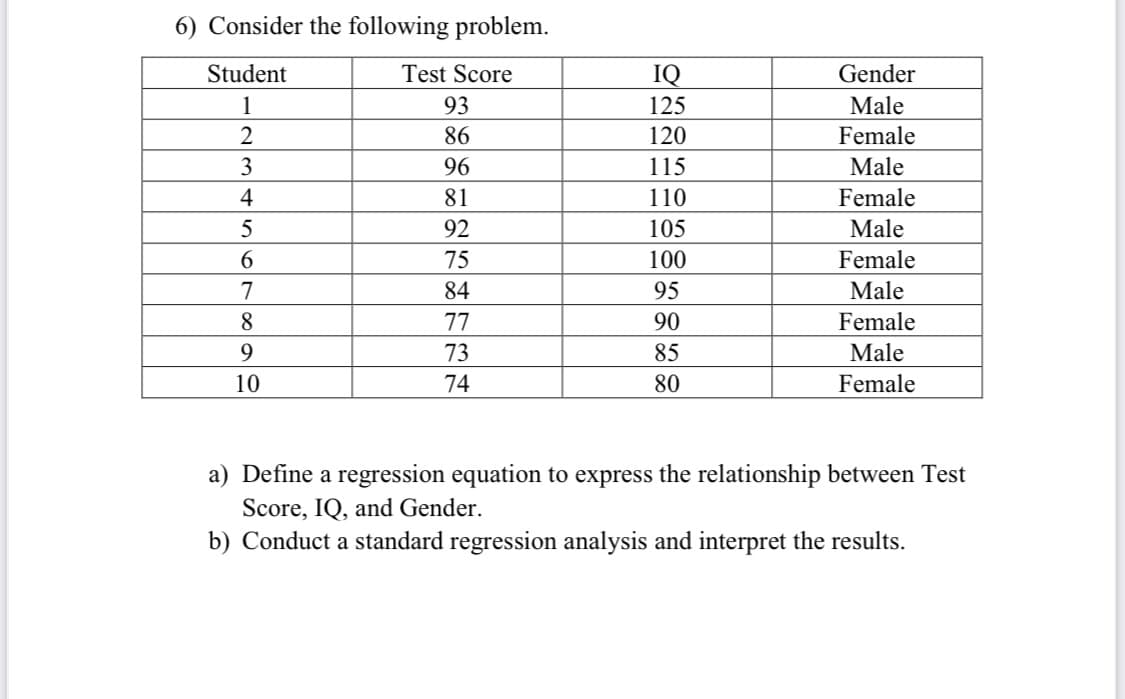
6) Consider the following problem. Student Test Score IQ Gender 1 93 125 Male 2 86 120 Female 3 96 115 Male 81 110 Female 92 105 Male 6. 75 100 Female 7 84 95 Male 8 77 90 Female 9. 73 85 Male 10 74 80 Female a) Define a gres equation to express the relat nship between Test Score, IQ, and Gender. b) Conduct a standard regression analysis and interpret the results.


Q: 5. Consider the following regression analysis of SCORE (the achievement test score of students in a…
A:
Q: A sales manager collected the following data on annual sales for new customer accounts and the…
A: y = 67.91+6.29x s = σ^ = 6.0862 ∑(x-x¯)2 = SSXX = 161.60 n = 10 X0 = 13 α=0.10
Q: Suppose the Sherwin-Williams Company is interested in developing a simple regression model with…
A: Enter Xi and Yi in excel sheet, Go to Data > Data Analysis> Regression Enter the range of X…
Q: Years of Work Experience and number of Job Offers of 10 job-seekers were as follows: Work Exp.…
A: from regression y = a + bx y is dependent variable = no of offers a intercept b is slope x…
Q: Suppose we have the following dataset with one response to variable y and two predictor variables x,…
A: The dependent variable Y and two independent variables X1 and X2 are given as: y x1 x2 140 60…
Q: The table below shows the number of state-registered automatic weapons and the murder rate for…
A:
Q: QUESTION 2 XXX Electric Illuminating Company is doing a survey on the relationship between…
A: Given data is No. of rooms 12 9 14 6 1 8 10 10 5 7 Kilowatt-hours(thousand) 9 7 10 5 8 6 8 10 4…
Q: Jensen Tire & Auto is in the process of deciding whether to purchase a maintenance contract for its…
A: Given information: Weekly Usage Expense 18 21 15 26 25 34 33 41 37 51 22 35 29 37…
Q: 2. Consider the following data for two variables, x and y. 32 18 15 26 у 10 20 21 16 22 a. Develop…
A: Regression analysis is used to study the relationship between two or more variables. Moreover, the…
Q: 5. а) The data showing the time required for a merchandiser to stock a grocery store shelf with a…
A: Data represents the time required for a merchandiser to stock a grocery store shelf with a soft…
Q: The following table gives information on the amount of sugar (in grams) and the calorie count in one…
A: Given regression equation is y=79.555+5.631x If x=15 then y=?
Q: Is there any multicollinearity problem in the above multiple regression model? How do you know?…
A: The independent variables are Age, Pressure and Smoker. The dependent variable is Risk stroke. This…
Q: 1.Consider the following two simple regression models : Model I : Y, = B, + B,X; + µ, Model II : Y,…
A: Hello! As you have posted more than 3 sub parts, we are answering the first 3 sub-parts. In case…
Q: 1. The table shows the rate of injury among young workers compared to the actual number of injury…
A: Given: X Y 1165711612110069980110401059586308962946010280…
Q: Do students with higher college grade point averages (GPAs) earn more than those graduates with…
A: Given data : GPA Salary ($) 2.22 72,000 2.29 48,000 2.57 72,000 2.59 64,000 2.77 88,000…
Q: The following table shows the annual number of PhD graduates in a country in various fields.…
A: Excel output:
Q: Interpret the estimated regression coefficient corresponding to the Z variable. Data Salary…
A: Multiple linear regression model: A multiple linear regression model is given as y = b0 + b1x1 +…
Q: In an attempt to assess the effect of the student's score in the admission test to their academic…
A: The provided information is Sore in admission test x Grade y xy x2 52 80 4160 2704 61 78…
Q: Jensen Tire & Auto is in the process of deciding whether to purchase a maintenance contract for its…
A: Since you have posted a question with multiple sub-parts, we will solve first three sub- parts for…
Q: Consider the following data and create a linear regression model: Data 1 2 3 6 Y 6 6 11 12 O…
A:
Q: The following table shows data for the cost of natural gas in Maryland (in dollars per Million Btu)…
A: a). Here, the price can be predicted using the year. Therefore, the price is the response variable…
Q: Consider the following data on x- weight (pounds) and y price ($) for 10 road-racing bikes. Brand…
A: Level of significance = α = 0.05 Weight Price($) 17.8 2100 16.1 6250 14.9 8370 15.9 6200…
Q: Eight students are selected randomly, and their present graduate GPA is compared to thei…
A: For the given data has to find ( a) Regression equation ( b ) Hypothesis test for Regression
Q: Consider the following sample of production volumes and total cost data for a manufacturing…
A:
Q: The following data relate to the marks of 10 students in the internal test and the university…
A:
Q: 23: The accountant of Manama Corporation has collected the following data on its copy machine costs…
A: a) Plotting the points on graph from given data: From the given data the line of best fit is:…
Q: Jensen Tire & Auto is in the process of deciding whether to purchase a maintenance contract for its…
A: The data shows the weekly usage and annual maintenance expenses for machines.
Q: Jensen Tire &. Auto is in the process of deciding whether to purchase a maintenance contract for its…
A: Note: Hey, since there are multiple subparts posted, we will answer first three subparts. If you…
Q: 5.) The owner of Showtime Movie Theaters, Inc., would like to predict weekly gross revenue as a…
A: The weekly gross revenue is the dependent variable (y). a. The estimated regression equation with…
Q: A survey conducted by a research team was to investigate how the education level, tenure in current…
A: Solution: 7. From the given information,
Q: 7) The following chart shows the distance from New City and the median housing prices in those…
A: Given: Distance from New City (x) Median home price (y) 12 390 15 400 28 310 20 290 5…
Q: Using data from 50 workers, a researcher estimates Wage = B0 + B1Education + B2Experience + B3Age +…
A: It is given that the results of regression analysis. Part (a-1) From the given output, the…
Q: City Room Rate ($) Entertainment ($) Boston 148 161 Denver 96 105 Nashville 91 101 New…
A: The given estimated regression equation is y-hat = 17.49 + 1.0334x and the value of SSE is…
Q: Consider the following data on x = weight (pounds) and y = price ($) for 10 road-racing bikes. Brand…
A: Given The following data on x=weight and y=price for 10 road racing bikes is given weight (x)…
Q: 1. How does the cost of shipping a standard-sized crate relate to the distance of the destination?…
A:
Q: A random sample of 9 statistics students produced the following data, Midterm Exam Score, x Final…
A: Given data: Midterm Exam Score, x Final Exam Score, y 81 49 62 23 76 84 26 58 96 33…
Q: A study was conducted to detemine whether a the final grade of a student in an introductory…
A: Steps to construct scatter plot in Excel: Enter the data for x and y in Excel sheet>Select the…
Q: 2.) The table below is about the academic performance in Mathematics of 10 students. Make a multiple…
A: Step-by-step procedure to find the regression line using Excel: In Excel sheet, enter x1, x2 and y…
Q: Suppose the Sherwin-Williams Company is interested in developing a simple regression model with…
A: For the given data the regression output, as obtained in excel, is as follows Coefficients…
Q: What can you say about SSE, SSR, and the utility of the regression equation for making predictions…
A:
Q: Jensen Tire & Auto is in the process of deciding whether to purchase a maintenance contract for its…
A: As per guidelines we will solve first question only, please repost other questions for more answers.…
Q: 1. The following model is a simplified version of the multiple regression model used by Biddle and…
A: Hi! Thank you for the question, As per the honor code, we are allowed to answer one question at a…
Q: #1) Use these data to develop an estimated regression equation that can be used to predict annual…
A: 1) The regression analysis is conducted using EXCEL. The software procedure is given below: Enter…
Q: predicting Al Ain secondary school students’ mental health scores via their scores in the life…
A: Given: Student Mental health score out of 50 Life- satisfaction score out of 100 1 40 80 2…
Q: The following data relate to the scores obtained by 9 salesmen of a company in an intelligence test…
A: Regression has two regression coefficients, they are slope and intercepts. Slope shows the variable…
Q: The following table gives information on the amount of sugar (in grams) and the calorie count in one…
A: The data gives information on the amount of sugar (grams) and the calorie count in one serving of a…
Q: Jensen Tire & Auto is in the process of deciding whether to purchase a maintenance contract for its…
A: Dear students as per guidelines we answer the first three subparts only. Solution We will use excel…
Q: Consider the following sample of production volumes and total cost data for a manufacturing…
A: The hypotheses are stated below: Correct option: Option 5
Q: Eight students are selected randomly, and their present graduate GPA is compared to their…
A: Introduction: Denote the response variable, Present GPA as y, and the explanatory variables, Undergr…


Trending now
This is a popular solution!

Step by step
Solved in 2 steps with 1 images

- The Wall Street Journal asked Concur Technologies, Inc., an expense management company, to examine data from 8.3 million expense reports to provide insights regarding business travel expenses. Their analysis of the data showed that New York was the most expensive city. The following table shows the average daily hotel room rate (X) and the average amount spent on entertainment (Y) for a random sample of 9 of the 25 most-visited U.S. cities. These data lead to the estimated regression equation y = 17.49 + 1.0334x. For these data SSE = 1541.4. Use Table 1 of Appendix B. a. Predict the amount spent on entertainment for a particular city that has a daily room rate of $89 (to 2 decimals). b. Develop a 95% confidence interval for the mean amount spent on entertainment for all cities that have a daily room rate of $89 (to 2 decimals). c. The average room rate in Chicago is $128. Develop a 95% prediction interval for the amount spent on entertainment in Chicago (to 2 decimals).The Wall Street Journal asked Concur Technologies, Inc., an expense management company, to examine data from 8.3 million expense reports to provide insights regarding business travel expenses. Their analysis of the data showed that New York was the most expensive city. The following table shows the average daily hotel room rate (X) and the average amount spent on entertainment (Y) for a random sample of 9 of the 25 most-visited U.S. cities. These data lead to the estimated regression equation y = 17.49 + 1.0334x. For these data SSE = 1541.4. Use Table 1 of Appendix B. (NEED ANSWER FOR A) a. Predict the amount spent on entertainment for a particular city that has a daily room rate of $89 (to 2 decimals).Suppose that a kitchen cabinet warehouse company would like to be able to predict the area of a customer’s kitchen using the number of cabinets and the kitchen ceiling height. To do so data is collected on the following variables from a random sample of customers: Area – area of the kitchen in square feet Height – ceiling height in the kitchen (from floor to ceiling) in inches Cabinets – number of cabinets in the kitchen Suppose that a multiple linear regression model was fit to the data and that the following output resulted: Coefficients: (Intercept)HeightCabinets Estimate-57.98771.2760.3393 Std. Error8.63820.26430.1302 t value -6.7134.8282.607 Pr(>|t|)2.75e-074.44e-050.0145 What is the predicted area of a kitchen with a height of 96 inches and 10 cabinets? Report your answer to 1 decimal place. square feet
- Suppose that a kitchen cabinet warehouse company would like to be able to predict the area of a customer’s kitchen using the number of cabinets and the kitchen ceiling height. To do so data is collected on the following variables from a random sample of customers: Area – area of the kitchen in square feet Height – ceiling height in the kitchen (from floor to ceiling) in inches Cabinets – number of cabinets in the kitchen Suppose that a multiple linear regression model was fit to the data and that the following output resulted: Coefficients: (Intercept)HeightCabinets Estimate-57.98771.2760.3393 Std. Error8.63820.26430.1302 t value -6.7134.8282.607 Pr(>|t|)2.75e-074.44e-050.0145 10 Question 10 This is not a form; we suggest that you use the browse mode and read all parts of the question carefully. Which of the following is the correct interpretation of the coefficient for Cabinets? For a kitchen with a given ceiling height, the average number of cabinets…Suppose that a kitchen cabinet warehouse company would like to be able to predict the area of a customer’s kitchen using the number of cabinets and the kitchen ceiling height. To do so data is collected on the following variables from a random sample of customers: Area – area of the kitchen in square feet Height – ceiling height in the kitchen (from floor to ceiling) in inches Cabinets – number of cabinets in the kitchen Suppose that a multiple linear regression model was fit to the data and that the following output resulted: Coefficients: (Intercept)HeightCabinets Estimate-57.98771.2760.3393 Std. Error8.63820.26430.1302 t value -6.7134.8282.607 Pr(>|t|)2.75e-074.44e-050.0145 Why is the interpretation of the constant term (i.e. "intercept") not meaningful for this example? The predicted area will be negative when the number of cabinets is zero and the height of the kitchen is also zero. But we cannot have a negative area, nor a kitchen ceiling height of 0 inches.…The issue of multicollinearity impacted the 'vadity and trustworthiness' of a regression model. demonstrate how this issue can be a problem by using an appropriate hypothetical and mathematical example.
- 1. Suppose you wanted to predict Winnings ($) using only the number of poles won (Poles), the number of wins (Wins), the number of top five finishes (Top 5), or the number of top ten finishes (Top 10). Which of these four variables provides the best single predictor of winnings?2. Develop an estimated regression equation that can be used to predict Winnings ($) given the number of poles won (Poles), the number of wins (Wins), the number of top five finishes (Top 5), and the number of top ten (Top 10) finishes. Test for individual significance and discuss your findings and conclusions.3. Create two new independent variables: Top 2–5 and Top 6–10. Top 2–5 represents the number of times the driver finished between second and fifth place and Top 6–10 represents the number of times the driver finished between sixth and tenth place. Develop an estimated regression equation that can be used to predict Winnings ($) using Poles, Wins, Top 2–5, and Top 6–10. Test for individual significance and…If a scatterplot is created in excel, and a line of regression is fit along with a derived functional form, what does it mean to describe and interpret them? What conclusions would be made about relationships between two recorded variables?The systolic blood pressure dataset (in the third sheet of the spreadsheet linked above) contains the systolic blood pressure and age of 30 randomly selected patients in a medical facility. What is the equation for the least square regression line where the independent or predictor variable is age and the dependent or response variable is systolic blood pressure? Y=__________ X + ______________ Patient 7 is 67 years old and has a systolic blood pressure of 170 mm Hg. What is the residual? __________ mm Hg Is the actual value above, below, or on the line? What is the interpretation of the residual? (difference in actual &predicated bp, difference in age, the amount of systolic changes)
- Is there any multicollinearity problem in the above multiple regression model? How do you know? Risk of Stroke (%) Age Pressure Smoker (Yes=1) 12 57 152 0 24 67 163 0 13 58 155 0 56 86 177 1 28 59 196 0 51 76 189 0 18 56 155 1 31 78 120 0 37 80 135 1 15 78 98 0 22 71 152 0 36 70 173 1 15 67 135 1 48 77 209 0 15 60 199 0 36 82 119 1 8 66 166 0 34 80 125 1 3 62 117 0 37 59 207 1Mr. James, president of Daniel-James Financial Services, believes that there is a relationship between the number of client contacts and the dollar amount of sales. To document this assertion, he gathered the following information from a sample of clients for the last month. Let X represent the number of times that the client was contacted and Y represent the valye of sales ($1000) for each client sampled. Number of Contacts (X) Sales ($1000) 14 24 12 14 20 28 16 30 23 30 a) Compute the regression equation for client contacts and sales. Interpret the slope and intercept parameters.A study is conducted to determine if there is a relationship between the two variables, blood haemoglobin (Hb) levels and packed cell volumes (PCV) in the female population. A simple linear regression analysis was performed using SPSS. Based on the SPSS output of the ANOVA table, which of the following statements is the CORRECT interpretation? 1. The regression model statistically significantly predicts the blood haemoglobin level. 2. About 39.98 % of variance in Hb is explained by PCV. 3. The regression model does not fit the data. 4. There is significant contribution of Hb towards PCV.