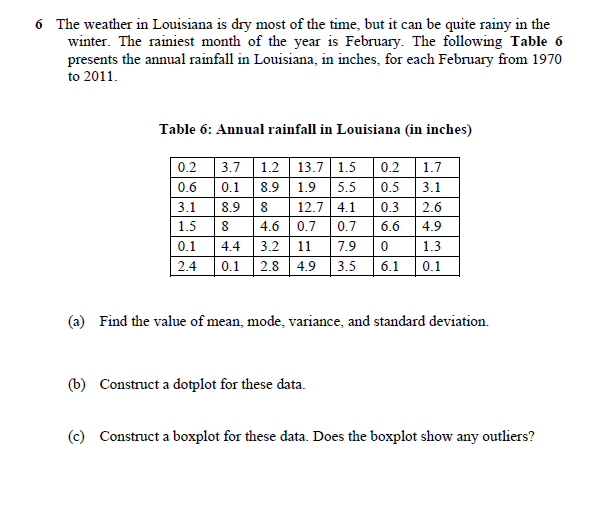
6 The weather in Louisiana is dry most of the time, but it can be quite rainy in the winter. The rainiest month of the year is February. The following Table 6 presents the annual rainfall in Louisiana, in inches, for each February from 1970 to 2011. Table 6: Annual rainfall in Louisiana (in inches) 3.7 1.2 | 13.7 1.5 0.1 8.9 | 1.9 3.1 0.2 1.7 3.1 2.6 6.6 4.9 7.9 0 1.3 3.5 6.1 0.1 0.2 0.6 5.5 0.5 8.9 8 12.7 4.1 0.3 4.6 0.7 | 4.4 3.2 | 11 | 2.4 1.5 8 0.7 0.1 | 0.1 |2.8 | 4.9 (a) Find the value of mean, mode, variance, and standard deviation. (b) Construct a dotplot for these data. (c) Construct a boxplot for these data. Does the boxplot show any outliers?
6 The weather in Louisiana is dry most of the time, but it can be quite rainy in the winter. The rainiest month of the year is February. The following Table 6 presents the annual rainfall in Louisiana, in inches, for each February from 1970 to 2011. Table 6: Annual rainfall in Louisiana (in inches) 3.7 1.2 | 13.7 1.5 0.1 8.9 | 1.9 3.1 0.2 1.7 3.1 2.6 6.6 4.9 7.9 0 1.3 3.5 6.1 0.1 0.2 0.6 5.5 0.5 8.9 8 12.7 4.1 0.3 4.6 0.7 | 4.4 3.2 | 11 | 2.4 1.5 8 0.7 0.1 | 0.1 |2.8 | 4.9 (a) Find the value of mean, mode, variance, and standard deviation. (b) Construct a dotplot for these data. (c) Construct a boxplot for these data. Does the boxplot show any outliers?

College Algebra (MindTap Course List)
12th Edition
ISBN:9781305652231
Author:R. David Gustafson, Jeff Hughes
Publisher:R. David Gustafson, Jeff Hughes
Chapter8: Sequences, Series, And Probability
Section8.6: Permutations And Combinations
Problem 4SC

Related questions
Question
please use the standard table below
Transcribed Image Text:6 The weather in Louisiana is dry most of the time, but it can be quite rainy in the
winter. The rainiest month of the year is February. The following Table 6
presents the annual rainfall in Louisiana, in inches, for each February from 1970
to 2011.
Table 6: Annual rainfall in Louisiana (in inches)
0.2 3.7 1.2 13.7 | 1.5
0.1
0.2
1.7
0.6
8.9
1.9
5.5
0.5
3.1
3.1
8.9
8
12.7 4.1
0.3
2.6
1.5
4.6
0.7
0.7
6.6
4.9
0.1
4.4
3.2
11
7.9
1.3
2.4
0.1
2.8 4.9
3.5
6.1
0.1
(a) Find the value of mean, mode, variance, and standard deviation.
(b) Construct a dotplot for these data.
(c) Construct a boxplot for these data. Does the boxplot show any outliers?
Transcribed Image Text:J Murdoch and JA Barnes
Statistical Tables
for Science. Engineering.
Management and Business Studies
Third edition
1-(u)
Revised and Expanded
Statistical Tables
for Science, Engineering,
Management and
Business Studies
J. Murdoch
B., A.R.T.C., A.M.LProd.E.
De f Menment
Selence Sdn
J.A.Barnes B.e., AR.C.S.
Sener Lerer
Thnd
Aeved and epanded
Maapm Science Sude
Cuf unf Tetk
Expert Solution
This question has been solved!
Explore an expertly crafted, step-by-step solution for a thorough understanding of key concepts.

Step by step
Solved in 2 steps with 7 images

Recommended textbooks for you
College Algebra (MindTap Course List)
Algebra
ISBN:
9781305652231
Author:
R. David Gustafson, Jeff Hughes
Publisher:
Cengage Learning

Algebra: Structure And Method, Book 1
Algebra
ISBN:
9780395977224
Author:
Richard G. Brown, Mary P. Dolciani, Robert H. Sorgenfrey, William L. Cole
Publisher:
McDougal Littell
College Algebra (MindTap Course List)
Algebra
ISBN:
9781305652231
Author:
R. David Gustafson, Jeff Hughes
Publisher:
Cengage Learning
Algebra: Structure And Method, Book 1
Algebra
ISBN:
9780395977224
Author:
Richard G. Brown, Mary P. Dolciani, Robert H. Sorgenfrey, William L. Cole
Publisher:
McDougal Littell