6) Use table 2 to answer the following questions: Image distance (mm) 146 174 170 165 175 167 163 171 161 166 157 173 162 148 180 165 175 176 158 174 161 176 166 158 164 169 157 153 175 159 159 160 174 156 166 166 173 158 168 166 173 159 151 160 155 168 166 165 164 175 161 171 167 166 164 163 156 162 167 164 Table 2: values from 60 repeat measurement of an image position a) Create a table displaying interval (x), and frequency from table 2 b) Draw up a histogram using the table created in a. c) Calculate the mean and standard deviation d) How many values lie within to of the mean and how many within ±20 of the mean?
6) Use table 2 to answer the following questions: Image distance (mm) 146 174 170 165 175 167 163 171 161 166 157 173 162 148 180 165 175 176 158 174 161 176 166 158 164 169 157 153 175 159 159 160 174 156 166 166 173 158 168 166 173 159 151 160 155 168 166 165 164 175 161 171 167 166 164 163 156 162 167 164 Table 2: values from 60 repeat measurement of an image position a) Create a table displaying interval (x), and frequency from table 2 b) Draw up a histogram using the table created in a. c) Calculate the mean and standard deviation d) How many values lie within to of the mean and how many within ±20 of the mean?

Mathematics For Machine Technology
8th Edition
ISBN:9781337798310
Author:Peterson, John.
Publisher:Peterson, John.
Chapter29: Tolerance, Clearance, And Interference
Section: Chapter Questions
Problem 16A: Spacers are manufactured to the mean dimension and tolerance shown in Figure 29-12. An inspector...

Related questions
Question
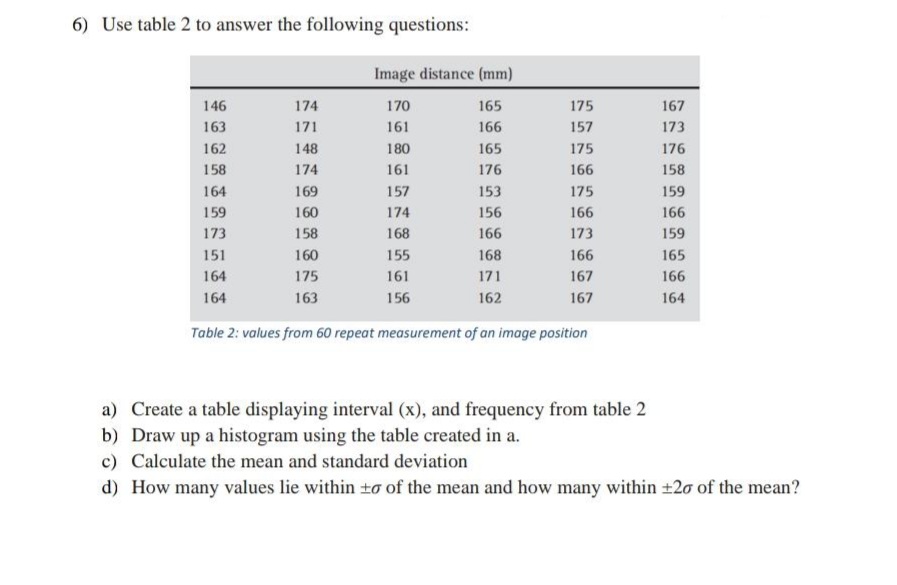
Transcribed Image Text:6) Use table 2 to answer the following questions:
Image distance (mm)
146
174
170
165
175
167
163
171
161
166
157
173
162
148
180
165
175
176
158
174
161
176
166
158
164
169
157
153
175
159
159
160
174
156
166
166
173
158
168
166
173
159
151
160
155
168
166
165
164
175
161
171
167
166
164
163
156
162
167
164
Table 2: values from 60 repeat measurement of an image position
a) Create a table displaying interval (x), and frequency from table 2
b) Draw up a histogram using the table created in a.
c) Calculate the mean and standard deviation
d) How many values lie within ±o of the mean and how many within ±20 of the mean?
Expert Solution
This question has been solved!
Explore an expertly crafted, step-by-step solution for a thorough understanding of key concepts.

Step by step
Solved in 2 steps with 1 images

Recommended textbooks for you
Mathematics For Machine Technology
Advanced Math
ISBN:
9781337798310
Author:
Peterson, John.
Publisher:
Cengage Learning,

Elementary Geometry For College Students, 7e
Geometry
ISBN:
9781337614085
Author:
Alexander, Daniel C.; Koeberlein, Geralyn M.
Publisher:
Cengage,

Glencoe Algebra 1, Student Edition, 9780079039897…
Algebra
ISBN:
9780079039897
Author:
Carter
Publisher:
McGraw Hill
Mathematics For Machine Technology
Advanced Math
ISBN:
9781337798310
Author:
Peterson, John.
Publisher:
Cengage Learning,
Elementary Geometry For College Students, 7e
Geometry
ISBN:
9781337614085
Author:
Alexander, Daniel C.; Koeberlein, Geralyn M.
Publisher:
Cengage,
Glencoe Algebra 1, Student Edition, 9780079039897…
Algebra
ISBN:
9780079039897
Author:
Carter
Publisher:
McGraw Hill