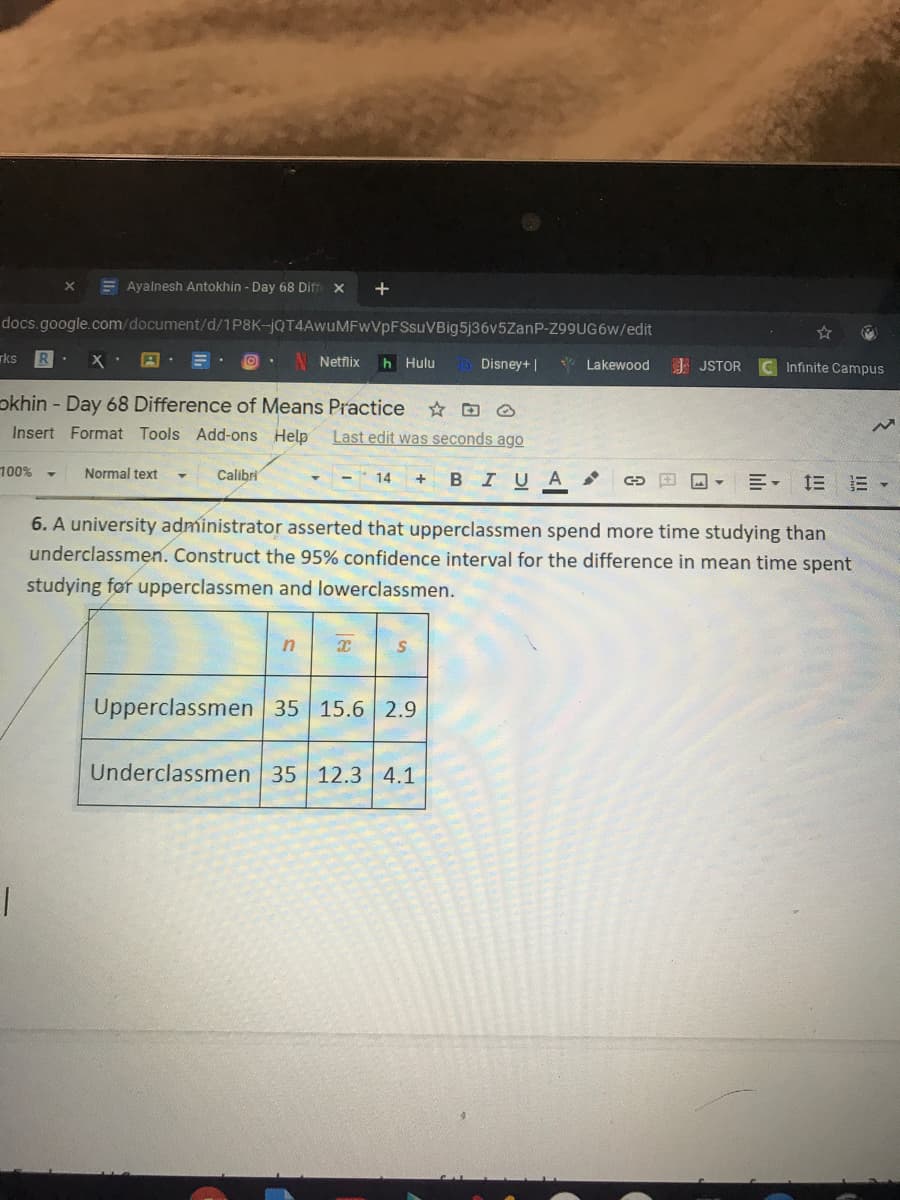
6. A university administrator asserted that upperclassmen spend more time studying than underclassmen. Construct the 95% confidence interval for the difference in mean time spent studying for upperclassmen and lowerclassmen. Upperclassmen 35 15.6 2.9 Underclassmen 35 12.3 4.1


Equations and Inequations
Equations and inequalities describe the relationship between two mathematical expressions.
Linear Functions
A linear function can just be a constant, or it can be the constant multiplied with the variable like x or y. If the variables are of the form, x2, x1/2 or y2 it is not linear. The exponent over the variables should always be 1.
The confidence interval formula is , where are sample means, are sample standard deviations, are sample size for first and second sample, respectively. is the critical value which depends on the confidence level and degrees of freedom.
Lets upperclassmen sample is first and underclassmen sample is 2. So the given data is , , .

Trending now
This is a popular solution!

Step by step
Solved in 2 steps


